Don’t go in the Water

Warming sea surface temperatures in low-salinity oceans like the Baltic Sea is increasing cases of Vibrio bacteria infections

WHO: Craig Baker-Austin, Nick G. H. Taylor, Rachel Hartnell, Centre for Environment Fisheries and Aquaculture Science, Weymouth, Dorset, UK,
Joaquin A. Trinanes, Laboratory of Systems, Technological Research Institute, Universidad de Santiago de Compostela, Spain, National Oceanic and Atmospheric Administration, National Environmental Satellite Data and Information Service, CoastWatch, Maryland, USA
Anja Siitonen, Bacteriology Unit, National Institute for Health and Welfare (THL), Helsinki, Finland
Jaime Martinez-Urtaza  Instituto de Acuicultura, Universidad de Santiago de Compostela, Spain

WHAT: Establishing patterns between Vibrio bacteria infection outbreaks and climate change in the Baltic Sea to be able to predict future outbreaks.

WHEN: January 2013

WHERE: Nature Climate Change, Vol 3, January 2013

TITLE: Emerging Vibrio risk at high latitudes in response to ocean warming (subs. req)

Imagine that it’s a hot summer’s day in Northern Europe. The heat wave has lasted for more than three weeks now and you’re just dying to get into the ocean for a swim to cool off, except that you can’t, because there’s been a bacteria outbreak in the water and going swimming will make you sick.

Looks great! Can’t swim. (photo: flickr)

Looks great! Can’t swim. (photo: flickr)

It doesn’t sound like fun does it? But it’s happening increasingly in the Baltic Sea, and it looks like climate change is providing the exact conditions these bacteria love.

Vibrio is a type of bacteria that grows really well in warm (>15oC) low-salinity (<25 parts per trillion salt) water. The most common type in estuaries and other shallow water is Vibrio vulnificus, which is related to the same bacteria that causes cholera (Vibrio cholerae). Not a nice family, really.

When you swim in water that has Vibrio bacteria, it immediately gets excited (yes, I’m aware that bacteria don’t have feelings) about any cuts or wounds you have and infects them giving you symptoms like vomiting, diarrhea, abdominal pains and blistering dermatitis. Well, that’s a way to really ruin your summer.

If you’re really unlucky or immuno-compromised, Vibrio will give you blistering skin lesions, septic shock (life threatening low blood pressure) and possibly kill you 25% of the time. It’s an efficient bacterium though, and will kill you in only 48hrs.

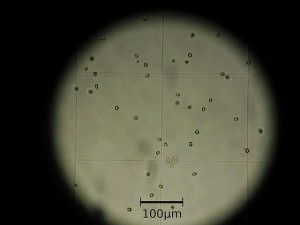
Vibrio vulnificus (Wikimedia commons)

Vibrio vulnificus (Wikimedia commons)

So why is Vibrio moving into the Baltic Sea more often? Climate change, combined with location.

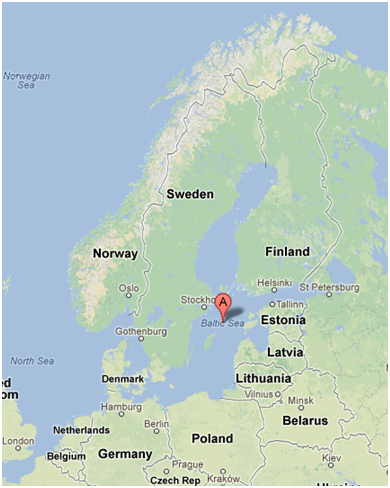
The Baltic Sea is the largest low-salinity marine ecosystem on Earth, and is surrounded by highly populated countries, meaning there are 30million people living within 50km of the shores of the sea. The Baltic Sea is also warming rapidly.

The Baltic Sea (Google maps)

The Baltic Sea (Google maps)

The researchers found that the sea surface temperature has been warming in excess of 1oC per decade, which is seven times the global average rate of warming. The rate is also increasing. From 1850 to 2010, the rate of warming was .51oC per century. The warming between 1900 to 2010 was at a rate of .77oC per century, and more recently the warming from 1980-2010 has been at a pace of 5oC per century, which is scarily fast for planetary systems.

Their data shows that for every 1oC increase in the summer maximum sea surface temperature, the rate of observed Vibrio infections increased by almost 2 times. This of course, gets compounded with the fact that increased summer maximum sea surface temperatures mean the air temperature is also hotter, and a hotter summer means more people head to the beach and get infected.

Even worse, recent research shows that some Vibrio bacteria’s ‘pathogenic competence’ (which is scientist for how good it is at infecting you) could be improved by increased temperatures.

Which all adds up to a nasty sequence of events where many more people than usual get nasty skin lesions. So what should we do about it? The researchers suggest monitoring conditions and sending out health advisories for when the sea surface temperatures are >19oC for three weeks or more as well as using predictive models to try and work out where/when the worst outbreaks might occur.

I don’t know about you, but nasty bacterial infections from a warmer ocean on a slowly cooking planet doesn’t sound like a good idea to me. So I’d also like to suggest we stop burning carbon so I and the people of Northern Europe can continue to swim in the summer.

Will the Well Run Dry? Non-renewable Water

Ancient groundwater sources are being depleted at fast rates and the impacts of climate change are still unknown

WHO: Richard G. Taylor, Department of Geography, University College London, London, UK
Bridget Scanlon, Bureau of Economic Geology, Jackson School of Geosciences, University of Texas at Austin, Texas, USA
Petra Döll, Institute of Physical Geography, University of Frankfurt, Frankfurt, Germany
Matt Rodell, Hydrological Science Branch, NASA Goddard Space Flight Center, Greenbelt, Maryland, USA
Rens van Beek, Yoshihide Wada, Marc F. P. Bierkens, Department of Physical Geography, University of Utrecht, Utrecht, The Netherlands
Laurent Longuevergne, Géosciences Rennes, Université de Rennes 1, Rennes, France
Marc Leblanc, School of Earth and Environmental Sciences, NCGRT, James Cook University, Cairns QLD, Australia
James S. Famiglietti, UC Center for Hydrologic Modelling, University of California, Irvine, USA
Mike Edmunds, School of Geography and the Environment, Oxford University, Oxford, UK
Leonard Konikow, U.S. Geological Survey, Reston, Virginia, USA
Timothy R. Green, Agricultural Systems Research Unit, USDA-ARS, Fort Collins, Colorado, USA
Jianyao Chen, School of Geography and Planning, Sun Yat-sen University, Guangzhou, China
Makoto Taniguchi, Research Institute for Humanity and Nature, Kyoto, Japan
Alan MacDonald, British Geological Survey, Edinburgh, UK
Ying Fan, Department of Earth and Planetary Sciences, Rutgers University, New Jersey, USA
Reed M. Maxwell, Department of Geology and Geological Engineering, Colorado School of Mines, Golden, Colorado, USA
Yossi Yechieli, Geological Survey of Israel, Jerusalem, Israel
Jason J. Gurdak, Department of Geosciences, San Francisco State University, San Francisco, California, USA
Diana M. Allen, Department of Earth Sciences, Simon Fraser University, Burnaby, British Columbia, Canada
Mohammad Shamsudduha, Institute for Risk and Disaster Reduction, University College London, London, UK
Kevin Hiscock, School of Environmental Sciences, University of East Anglia, Norwich Research Park, Norwich, UK
Pat J.-F. Yeh, International Centre for Water Hazard and Risk Management (ICHARM), UNESCO, Tsukuba, Japan
Ian Holman, Environmental Science and Technology Department, Cranfield University, Milton Keynes, UK
Holger Treidel, Division of Water Sciences, UNESCO-IHP, Paris, France

WHAT: Looking at all the research on groundwater and working out what we know and what we don’t know

WHEN: 25 November, 2012

WHERE: Nature Climate Change, 2012 nclimate1744

TITLE: Ground water and climate change (subs req.)

Last month, 26 scientists all published a paper together on groundwater, which must have required either some massive Skype sessions, or people getting very sick of email chains where everyone hits ‘reply all’. As I’ve said before: science – it’s a collaborative thing.

What these researchers were trying to do was to work out exactly what we know about groundwater and how it will be affected by climate change and where the gaps are that we need to fill. Having worked in water policy, I can tell you that groundwater is normally the big unknown. Governments and organisations generally don’t have the information to know how much there is, who is taking it at what rates and how to monitor and regulate it. Generally, it gets put off until next time, while surface water rights are dealt with.

However, groundwater is estimated to be one third of all freshwater withdrawals worldwide and also the water source for 42% of the world’s agricultural water. So with climate change affecting rain patterns and shifting weather pole-ward, what will happen to groundwater? Will the well run dry in some places?

One of the biggest issues with measuring groundwater is the rate of recharge for the underground aquifers. These underwater storage vaults of water and mostly ancient water in that if you measure the isotopic composition of the water, they were likely filled thousands of years ago and have remained there without changing greatly.

Another interesting thing the isotopic analysis of the water tells us, is that if you look at the oxygen and hydrogen isotope ratios (so that’s the ratio of atoms that have different numbers of neutrons, making some heavier than others), many aquifers were filled in the late Pleistocene and early Holocene eras, around 12,000 years ago when the average temperature of the earth was around 5oC cooler than now.

Isotopic analysis: Hydrogen on the left and it’s isotope Deuterium (with the extra neutron) on the right

Isotopic analysis: Hydrogen on the left and it’s isotope Deuterium (with the extra neutron) on the right

What that means is that if those aquifers were recharging when the world was 5oC cooler than now, it’s unlikely that any recharge is taking place now or going to take place as we continue to heat our world through climate change. As the paper says ‘this non-renewable groundwater exploitation is unsustainable and is mined in a manner similar to oil’. Thousand year old water is just as renewable as million year old oil, and both are longer than a human life span.

So, what do we know about groundwater? There are two ways that groundwater can recharge: rain fed (the rain soaks into the ground) and surface water leakage (from rivers, irrigated agriculture or lakes). Both of these methods will be variable and vulnerable to climate change.

Changes in snow pack and snow distribution also impact recharge. The research currently published is still uncertain as to the extent of the impacts, but early findings are that the early start to spring is reducing the duration of recharge. Glacial retreat also impacts groundwater.

The other affects on groundwater are land use change and sea level rise inundating areas and making them salty. Managed ecosystems are not able to respond to change the way natural ecosystems can. Even if it’s a drought year, a farmer still needs to plant and crop their land. For each degree of climate change, you can roughly estimate that the equivalent climate will move 150km towards the pole. The desert of Salt Lake City will move north into the cropping areas of Idaho, and the slushy snow will move north into the ‘champagne powder’ ski regions.

More importantly, global estimates of groundwater depletion by 2050 range from 70% decreases in the Mediterranean and Brazil to increases in the Middle East and only 10% decreases in the Western US. There’s lots of uncertainty in the models as there’s a lack of data, so researchers need to extrapolate from incomplete data, resulting in large uncertainty margins.

One interesting thing I learned from this paper that I hadn’t considered before is that groundwater depletion increases sea level rise. How, you may ask? It’s the thing of living in a planetary system where everything is connected, so follow me through the water cycle here:

Thousand year old water that has been stored in the ground is pumped up a well and onto your farm. Some of the water will evaporate and the other water will grow plants, but the water has now gone into the atmospheric water cycle, so the evaporated water goes into the clouds, comes down as rain, and since 70% of our planet is ocean, there’s a really high chance the ancient groundwater will get added to the ocean. How much water? This is where it gets scary.

Groundwater water cycles (from paper)

Groundwater water cycles (from paper)

The paper talks about cubic kilometres of water. Yes, kilometres. I was unable to mentally picture that too, so I did a conversion for you. The groundwater depletion for the planet is between 145 – 204km3 of water per year, which is between 145,000 and 204,000 billion litres of water. To visualise this, you’d need to take the island of Manhattan and cover it twice with 1km deep water, which would be a depth of 4.5 Empire State Buildings end to end. This contributes between 0.4-0.5mm of sea level rise each year.

Climate change will have an effect on groundwater resources. Exactly what that is won’t be known until all the data is collected to create detailed models. However, sustainable aquifer management is going to be difficult and grow increasingly difficult as the climate continues to change.

World Bank Wants off the Highway to Hell: Part Two

‘Given that it remains uncertain whether adaptation and further progress toward development goals will be possible at this level of climate change, the projected 4°C warming simply must not be allowed to occur’ World Bank report

WHO: The Potsdam Institute for Climate Impact Research and Climate Analytics, commissioned by the World Bank

WHAT: A report looking at the impacts of 4oC of global warming and the risk to human systems

WHEN: November 2012

WHERE: The World Bank’s website

TITLE: Turn down the heat: Why a 4oC warmer world must be avoided

This is part two; part one is here.

What does a 4oC world look like?

It looks like a place where climate change has undermined economic growth through natural disaster after natural disaster which eventually overwhelms emergency response capabilities.

It looks like a world where all of the gains towards to the Millennium Development Goals of eradicating poverty and hunger have been wiped out by the negative impacts of climate change, and extreme heat stress has caused a 60% or more reduction in crop yield.

It looks like a world where even wealthy industrialised countries are no longer able to adapt to or meet development goals because of climate change and where entire coastal cities have been abandoned because the cost of fortifying them against rising sea levels was too great.

New York City in a 4oC world?
(Photo from New York Times Sunday Review Nov. 25th 2012 via ClimateProgress)

How could this happen? How could the change from 2oC to 4oC be the difference between continuing economic growth in a green economy and abandoned flooded cities?

Non-linear and cascading impacts.

Cast your minds back with me to high school math where you learned about exponential graphs. The ones that were y=x2 and you had to solve for x in your exams and it hurt your brain? This is non-linear and what is likely to happen with the planet. Take the oceans for example. While we still have sea ice in the Arctic, the warming from the oceans sucking up almost half of our carbon emissions every year is still relatively slow. However, once the ice melts and it’s all open water for the first time, that’s when warming gets going and it will likely ramp up like an exponential graph.

In fact, if you really feel like nerding it up, you can simulate sea ice at home and watch the tipping point happen. Put ice and water into a pot and once it’s cold (1-2oC) turn the heat on high and take the temperature every 30 seconds until the ice is all gone and the water is getting hotter (15-20oC or longer if you want). Graph the results and find your tipping point. Science!

Simulating Arctic ice melt: science! (photo: ©Adam Hart-Davis)

The final chapter in the World Bank report looks at the potential implications for a 4oC world in terms of risk management. If it’s going to cost a certain number of trillion dollars to prepare for 2oC, should we just double the amount and prepare for 4oC? They think that may not be enough since ‘lurking in the tails of the probability distributions are likely to be many unpleasant surprises’.

The report points out that since cascading effects are very difficult to predict, that most of the predictions I covered in part one are based on linear models and likely to be conservative estimates of what will happen with 4oC warming. They are also sector based and don’t take into account what happens when impacts team up and work together.

Going back to the oceans again, what will the cumulative impacts be of all the effects that have been studied separately? What happens when coral reefs collapse, marine production reduces from rising temperatures and acidification, low-lying coastal areas are inundated from sea level rise, and human economic and social impacts are all lumped together at the same time?

The report states that there is a high level of concern that all of those effects all happening together at once hasn’t really been studied or quantified beyond ‘horrifying’.

From what we know now from all of the leading research, this is a list of potential tipping points from the report:

1.5oC
This may be the coral reef tipping point which will create larger storm surges for coastal areas that were previously protected. It also means an economically significant loss of tourism dollars for places like the Great Barrier Reef.
This could also be the tipping point for the Greenland Ice Sheet which has been melting faster than expected (was previously predicted for 4.6oC). There is approximately 6-7m of sea level rise in this ice sheet, so New York City may need to move inland.

3oC
This could be the tipping point for the Amazon Rainforest, where large parts of the rainforest die off from lack of water and release more carbon into the atmosphere, further fuelling climate change in a positive feedback loop that it will be almost impossible to recover from.
This could also be the point for the West Antarctic Ice Sheet which has 3m of additional sea level rise stored in it. New York City will need to keep moving.

4oC
This is the probable tipping point for world agriculture as crops start dying from heat stress. The IPCC assessment predicts that crop yields will decrease between 63-82%. Keep in mind that this goes hand in hand with a population increase to 9 billion people.
This is also the point at which the accumulated stresses from 2oC and 3oC overwhelms emergency and health services and all of the gains made to alleviate poverty are also overwhelmed by the negative consequences from climate change.

Once the World Bank has laid out for us exactly how horrible it could possibly get in a way we can’t easily predict, plan for, adapt to safely or afford, this is the very simple conclusion they have that we should all be able to agree with:

‘Given that it remains uncertain whether adaptation and further progress toward development goals will be possible at this level of climate change, the projected 4°C warming simply must not be allowed to occur—the heat must be turned down. Only early, cooperative, international actions can make that happen.’

World Bank Wants off the Highway to Hell

“It is my hope that this report shocks us into action… This report spells out what the world would be like if it warmed by 4 degrees Celsius… The 4oC scenarios are devastating.” Dr. Jim Yong Kim President, World Bank

WHO: The Potsdam Institute for Climate Impact Research and Climate Analytics, commissioned by the World Bank

WHAT: A report looking at the impacts of 4oC of global warming and the risk to human systems

WHEN: November 2012

WHERE: The World Bank’s website

TITLE: Turn down the heat: Why a 4oC warmer world must be avoided

Following on from last week’s Highway to Hell post, the World Bank released a report looking at the human system implications for climate change because things that disturb the current systems of running the world tend to be expensive for organisations like the World Bank.

The report looks at climate change projections for a 4oC world, most of which I’ve already covered on this blog like; ocean acidification, droughts, tropical cyclones, sea level rise and extreme temperatures. So I’m going to skip ahead to the chapters on impacts in different sectors and then my personal favourite, non-linear impacts. This week will be sector impacts.

It’s refreshing to see an organisation that is normally known for its staid and stuffy conservatism talking about climate change reality. The foreword by the World Bank’s President says no less than that the science is unequivocal, that warming of 4oC threatens our ability to adapt and that meeting the currently agreed upon UNFCCC targets (which we’re not meeting) will lead to 3.5-4oC warming which must be avoided through greater and more urgent action now.

Let’s look at what this bastion of the three piece suit with not a dreadlock in sight says about the impacts that could be felt in a 4oC world.

Agriculture
Generally the impacts for agriculture will be regionally specific, as will the impacts for climate change. Some regions will get more rain, some less rain, and the timing of the seasons will change.

The favourite argument of luke-warmists is that increased CO2 in the atmosphere is excellent because it will benefit agricultural growth and we’ll be able to grow lettuce in Siberia. Well, yes and no – it’s more complex than that. Between 1-3oC of warming it’s likely we’ll see increased yields in certain regions from CO2 fertilization. Beyond 3oC productivity will decrease as the stresses of other climate change impacts outweigh any benefit from extra CO2.

And even then, demand from a world population growing to a projected 9 billion by 2050 is going to increase demand by 70-100% for agricultural food products, so even without the costs of climate change reducing the productivity of crops, it’s going to be difficult to feed the world with that many people.

Another vulnerability for agriculture is sea level rise and salination of some of the world’s most productive agricultural land. Having to move your farm from a nutrient rich delta to less productive soil further inland will detrimentally affect crop yields.

Finally, the benefits of CO2 fertilisation will be limited by the availability of other nutrients. You can give a plant all the CO2 it wants, but if you don’t also give it nitrogen, phosphorus and water, it’s not going to grow any faster. It’s currently looking like there’s going to be a world shortage of phosphorus based fertilizer, which will have a very detrimental affect on world crops that need to be becoming more productive to feed a growing population, not less.

Water Resources
This section starts with a very obvious statement that is useful to point out: ‘The associated changes in the terrestrial water cycle are likely to affect the nature and availability of natural water resources and, consequently, human societies that rely on them.’

We rely on the services that the environment provides for us and the second most important one of these is water (the first one is air).

As well as the expected (and already occurring) more severe droughts, river runoff is expected to decrease significantly in areas where the water is used for both agriculture and transport like the Danube, the Mississippi, the Amazon and the Murray-Darling Basin in Australia.

In a 2oC warming world, most of the water stresses can be expected to be from population increase. By the time we get to a 4oC world, the stress of climate change will outstrip that of population increase. Even in the areas where there will be increased rainfall, it’s not likely to come at the right time of the year, or it could come all at once causing flooding.

There’s a lot of uncertainty in many models of drought prediction and rainfall prediction as well as the possible effects for specific regional areas, but the conclusions that are coming from all of the studies identified in this report range from bad to very bad, and in a 4oC world almost half of the world’s population could be water stressed by 2080.

Ecosystems and Biodiversity
This is the fun section that starts using terms like ‘mass extinction’ and gets everyone Googling things like the Eocene.

Biodiversity is, in my opinion going to be the ‘sleeper issue’ of climate change, because it happens over longer periods of time and is easy to ignore as out of sight out of mind for us urbanites until it’s too late. As the report quotes; ‘It is well established that loss or degradation of ecosystem services occurs as a consequence of species extinctions’.

There’s also the issue of thresholds. Where an animal or plant or ecosystem can absorb a certain amount of degradation, until you reach the tipping point and it can no longer take it. Some areas will be able to absorb more warming (Canada, Northern Europe) while others may reach biodiversity and ecosystem tipping points earlier (Pacific Islands, Bangladesh).

In a 4oC world, it’s possible that habitats could shift by up to 400km towards the poles, which is fine if you’re a mosquito moving north from Mexico, but not so good if you’re a mountain rabbit and you run out of mountain.

And here’s some food for thought: the report states that if the planet lost all of the species that are currently listed as ‘critically endangered’ we would officially be living through a mass extinction, and if we lost the species that are also ‘endangered’ or ‘vulnerable’ we would be confirmed as the sixth mass extinction in geological history. Which means history would list the dinosaurs and then the humans in the fossil record of mass extinctions.

As the report says: ‘loss of biodiversity will challenge those reliant on ecosystem services’. This means all of us.

Human Health
Like smoking, climate change is bad for your health. The above mentioned agricultural and water issues with a 4oC warmer world will lead to famine and malnutrition on a large scale. The extreme weather events from a planet on climate steroids will kill people in heat waves, increase respiratory diseases and allergies from the extra dust in the droughts, weaken existing health services through damage to hospitals in extreme storms, flooding and so on.

Living with constant extreme weather is bad for your mental health, whether it’s the slow and painful crush of watching drought destroy your farmland or the fast emergency of cyclones, hurricanes and floods.

And remember the mosquitoes moving north? They’ll bring new tropical diseases with them that will infect many new people who have never developed any immunity to them.

Given all of the above, it’s pretty clear why the World Bank wants off the highway to hell. Because they’re concerned about both loaning money to countries that are dealing with these catastrophes, and living through these impacts. Because, as all of my fellow Gen Ys already know, living these impacts by 2050 is not some vague and distant future. It’s before we all retire.


Next week: non-linear impacts, which are scarier than they sound. 

Getting off the Highway to Hell

Climate change is kicking in faster that expected, and the global threshold of 2oC is now considered the line between dangerous and extremely dangerous climate change. What will it take to avoid this highway to hell?

WHO: Kevin Anderson, Tyndall Centre for Climate Change Research, School of Mechanical, Aerospace and Civil Engineering, University of Manchester, UK  and School of Environmental Sciences and School of Development, University of East Anglia, Norwich, UK
Alice Bows, Sustainable Consumption Institute, School of Earth, Atmospheric and Environmental Sciences, University of Manchester, UK

WHAT: Some carbon budgetary truths for the world – how much do we have left to burn and when do we have to stop it by?

WHEN: 13 January 2011

WHERE: Philosophical Transactions of the Royal Society of London A: Mathematical, Physical and Engineering Sciences. Phil. Trans. R. Soc. A vol. 369, no. 1934

TITLE: Beyond ‘dangerous’ climate change: emission scenarios for a new world

Have you ever seen one of those reality TV shows where a person who is hopeless with money is given some budgeting ‘real talk’ and taught to live within their means? This paper is going to do that for your carbon budgets.

Humans love to procrastinate – we’re great at it. And despite all the new semester resolutions of keeping on top of the work this time, it inevitably leads to last minute late night exam cramming. However, it looks like climate change doesn’t have this problem. Currently, the arctic ‘death spiral’ is decades ahead of melting from climate change schedule, the Great Barrier Reef in Australia is already 50% bleached and dead and the drought predictions for the south west of the USA are also ahead of schedule.

This means that the globally declared point that we shall not pass for global warming of 2oC has now been upgraded from the line between acceptable and dangerous climate change to the border between dangerous and extremely dangerous climate change. Congratulations on the promotion 2oC?

So now that procrastinating past 2oC is looking like a dangerous decision, what do we need to do about it?

These researchers looked at the Copenhagen Accord from the 2009 UNFCCC negotiations (remember the non-binding one?) and it states that we must act to prevent going above 2oC of global warming on the basis of science and equity. Since it’s the cumulative emissions that are really going to bite us, the researchers decided to work from the end point of preventing 2oC in different scenarios and then worked the carbon budgets backwards to see if we have a chance of meeting the 2oC goal and how we could do it.

The UN separates the UNFCCC agreement into two groups: Annex 1 countries (which is the developed world) and non-Annex 1 countries (the developing world). Keeping with the ideal of equity, the scenarios in this paper allow for emissions to grow in the developing world longer than they can grow in the first world. However, the paper did point out that if developing nations grow into developed fossil fuel economies, their emissions will outstrip world emissions from the industrial revolution to the 1950s, so mitigation in the developing world is going to be increasingly important really fast.

The paper does three scenarios and then tweaks each one. The first scenario only counts CO2 emissions which allows it to be more accurate, but doesn’t include other greenhouse gases. The second scenario includes all six main greenhouse gases which makes it less accurate (more variables) but also more realistic. The third scenario looks at what is currently considered ‘politically possible’ in terms of emissions reductions. It gets long, so I’ll provide a handy summary table too!

Interestingly, the Bill McKibben budget of 565 Gigatonnes (Gt) of carbon (2055 Gt of CO2) from his Rolling Stone article is not considered here, because the chance of blowing past the 2oC limit is too high.

Here’s how they worked out:

CO2 only with a small budget
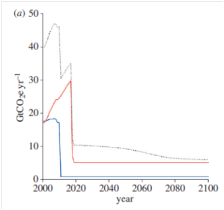
If we have a carbon budget of 1321 Gt CO2 and emissions from the developing world grow at less than 3% per year until 2015, and reduces by 6% per year after 2020, and the first world reduces their emissions from now by 11% per year, we have a 36% of still causing extremely dangerous climate change.

If we do the above but the developing world’s emissions grow until 2025, they’ve spent the whole carbon budget at once and we blow past 2oC. But if the developing world’s emissions grow at less than 1% until 2025 and they reduce their emissions by 7-8% per year while the first world reduces by 11% per year from now, then there’s a 37% chance of causing extremely dangerous climate change. The researchers described this one as ‘plausible but highly unlikely’.

CO2 with a small budget scenarios with a 36% chance (a), blowing the budget (b) and a 37% chance (c). Blue line is first world emissions, red line is developing world emissions, dotted line is global emissions including deforestation (from paper)

CO2 only with a bigger budget
So what happens if we’re a bit more realistic and increase the burnable budget a bit? If we have a carbon budget of 1578 Gt CO2 and emissions from the developing world grow by 4% per year until 2015, first world emissions don’t grow and global emissions reduce by 5-6% per year from 2015, we have a 50% chance of causing extremely dangerous climate change.

If there is a 5 year delay and emissions in the developing world grow by 4% per year until 2020, and then reduce by 7-8% per year after that while the first world reduces by 7-8% per year from 2010 (yes, from two years ago), then the 5 year delay bumps us up to a 52% chance of causing extremely dangerous climate change, even with the faster reductions. Given we needed to start two years ago, that one’s out too.

If the developing world misses the 7-8% per year reduction targets above and only reduce emissions by 4-5% per year, they spend all the carbon budget and we either blow past 2oC or first world emissions fall immediately to zero in 2015. Also not workable then.

CO2 with a bigger budget with a 50% chance (a), with a 52% chance (b) and blowing the budget (c) (from paper)

Counting all the gases with a small budget
If we include all the other greenhouse gases like methane and nitrous oxide (which means we start talking CO2 equivalent because otherwise it’s really unwieldy to count), we can also count emissions for food production for the 9 billion people we’re going to have on the planet by 2050, which will be around 6 Gt Co2e per year (animals fart methane and crops need nitrogen among other things) and further reduces the carbon budget.

If the budget is 1376 Gt CO2e and the developing world’s emissions grow at less than 3% per year until 2015, emissions in the first world need to drop to zero in 2015. So that budget is bust too.

All GHGs with a small budget which goes bust

Counting all the gases with a bigger budget
If the budget is 2202 Gt CO2e and the developing world increases emissions by less than 3% per year until 2015 and then decreases by 6% per year and the first world reduces emissions by 3% per year until 2020 and then 6% per year after that, we have a 39% chance of causing extremely dangerous climate change.

If the developing world grows at 3% per year until 2020 and then reduces emissions by 6% per year, the first world needs to reduce emissions by 10% per year from 2010. So that budget is also bust.

If the developing world only grows at 1% per year until 2025 and reduces by 4-5% per year, the first world’s emissions need to be flat to 2014 and reduce by 6% per year after that. If we could do that we would have a 38% chance of causing extremely dangerous climate change.

All GHGs with a bigger budget 39% chance left, busting budget middle, 38% chance right (from paper)

But here’s the problem; currently what is considered politically and economically possible for reducing carbon emissions is reductions of 3% per year. Which blows all of these budgets.

If we only counted the CO2,had a budget of 2741 GtCO2 (which is higher than any of the budgets above) and reduced our emissions by 3% per year from 2015 in the first world and 2030 in the developing world, we have an 88% chance of causing extremely dangerous climate change.

The politically feasible options counting CO2 left and all GHGs right, both with 88% chances of blowing 2oC (from paper)

If we counted all the gases and had a larger budget of 3662 Gt CO2e with reductions of 3% per year as above, we get the same result. This means that business as usual is actually business on the way to 4oC of global warming, which has been described by the one of the authors of this paper Kevin Anderson as

incompatible with organized global community, is likely to be beyond ‘adaptation’, is devastating to the majority of ecosystems & has a high probability of not being stable i.e.  4°C would be an interim temperature on the way to a much higher equilibrium level’

Scenarios in table form for quick reference (click for bigger version)

Basically, what we’re currently doing is going to fail spectacularly in the near future. And since physics doesn’t negotiate we can’t get an extension on this one. If we are to make any of the carbon budgets above, society needs to be reducing carbon emissions at a much higher rate than we currently are.

I’d like to finish with the conclusion from the paper, because I think their version of climate tough love is excellent:

This paper is not intended as a message of futility, but rather a bare and perhaps brutal assessment of where our ‘rose-tinted’ and well intentioned (though ultimately ineffective) approach to climate change has brought us. Real hope and opportunity, if it is to arise at all, will do so from a raw and dispassionate assessment of the scale of the challenge faced by the global community. This paper is intended as a small contribution to such a vision and future of hope.

How Does Your Wind Farm Grow?

Calculating what the global saturation point for wind energy would be and if we can generate enough wind power to power half the globe.

WHO: Mark Z. Jacobson (Department of Civil and Environmental Engineering, Stanford University, Stanford, CA)
Cristina L. Archer (College of Earth, Ocean, and Environment, University of Delaware, Newark, DE)

WHAT: Predicting the effectiveness of scaling up wind power to provide half the world’s power requirements by 2030.

WHEN:  September 25 2012 PNAS, Vol 109, No. 39

WHERE: Proceedings of the National Academy of Sciences of the United States of America

TITLE: Saturation wind power potential and its implications for wind energy

I learnt about a new law today; Betz’s Law. Betz was a guy who decided to calculate exactly how much energy could be extracted from the wind by a turbine at any given time mathematically (as you do). He worked out that no turbine can take any more than 59.3% of the energy from the wind. To be able to conceptualise this, you have to think about wind like a physicist. The first law of thermodynamics states that you can’t create or destroy energy; you can only convert it to different forms. Therefore, all wind is just energy in a certain form, and in any system there is a point where the transformation is most efficient and beyond there it takes a lot of effort to get any more energy from the system.

There’s a really cool project being done in the US, where a website has taken data from the National Digital Forecast Database and created a visual representation of what wind would look like if you could see it move. It’s strikingly beautiful, and looks a lot like a Van Gogh painting.

Wind Map by Fernanda Viegas and Martin Wattenberg of hint.fm

The question this paper looks at is: since there is a limit to the amount of energy you can take from a turbine, what is the maximum wind power that can be extracted from a geographical area? They called it the ‘Saturation Wind Power Potential’.

They came up with some interesting findings, as well as probably having a lot of fun along the way because they used 3D Models to do it (I’m telling you, my chemistry molecular model kit was much more like playing with Lego than actual ‘science’). They got into the detail and calculated the potential wind power at 10m off the ground, 100m off the ground (the standard height of a wind turbine) and 10km off the ground in the jet stream.

They then looked at whether it would be possible to scale up wind power globally to meet 50% of the world’s power needs by 2030. Actually measuring the wind power potential for more than 1 Terrawatt (TW) of energy is not possible as there isn’t enough wind power installed yet. But they did mathematically work out that we would need 4million 5 Megawatt (MW) turbines to supply half of the world’s electricity needs in 2030 (5.75TW).

They did four simulations with different turbine densities, because how close together wind turbines are affects their ability to produce power. Put them too close together and they start stealing their neighbour’s wind power. Overall, up to 715TW, the increased number of turbines increases the amount of power in a linear straight line. Once you get above that it slows down and flattens out – once again you need to put much more effort in to get power out.

Predicted wind power saturation potential (from paper)
Grey line – global wind power potential, black line – wind power potential on land only

The saturation point, where no matter how many more turbines you add, they’ll just be stealing energy from each other and not adding anything to the total, was 2,870TW of power globally. Interestingly, they found the wind power available in the jet stream (10km above the ground) was 150% greater than the wind power available 100m above the ground.

There were also some big changes to the results depending on the density. If we placed 4million 5MW turbines and packed them in at 11.3 Watts per m2 (W/m2), they would be too close together and the collected power wouldn’t match the target for half the world’s power by 2030. If you spread them out to 5.6W/m2 the output is still too low. However, once you’ve got them spaced at 2.9W/m2, they produce enough power to meet the required demand.

4million turbines meet demand when they’re 2.9W/m2 apart or further (from paper)

So it turns out wind turbines don’t like it when you cramp their style. But, you can pack them in a bit tighter, only if you then have enough space between your wind farm and your neighbour’s wind farm. It’s a bit like playing wind farm Tetris.

What does this mean though? It means that we can ramp up world wind power production to levels that will meet half our power needs in 2030, which can be integrated with hydro, solar and other renewables with smart grids to power our cities and lifestyles without burning fossil fuels. But it also means we need to think about where we are putting wind farms and how much space they need to be as efficient as possible. We need that renewable energy, so we can’t cramp the wind turbines’ style!

Getting into gear: required rates of climate action

“The decarbonisation of global energy sources is the only available means of effective mitigation of global CO2 emissions while still allowing society to grow as it has done historically.”

WHO:  A. J. Jarvis, D. T. Leedal, C. N. Hewitt (Lancaster Environment Centre, Lancaster University)

WHAT:  Finding a mathematical relationship between social actions for carbon emissions mitigation and global temperature change

WHEN: September 2012

WHERE: Nature Climate Change, Vol. 2, September 2012

TITLE: Climate–society feedbacks and the avoidance of dangerous climate change (subs. required)

We all get the idea that the actions of people and society as a whole (particularly in the first world) are causing climate change. Or at least we should get that by now. Humans are burning the fossil fuels which are polluting our atmosphere. It’s pretty tightly linked. But these researchers weren’t just content with sitting back and assuming everybody got that link. So they went about proving it mathematically. Yay for maths nerds!

The researchers figured that since global temperature changes are linked with increased CO2 emissions, then you should be able to work out how much effect social actions to prevent global warming have on global temperature changes. And if you can measure those effects, then it can create positive feedbacks to keep us all going in the same way getting on the scales and seeing a smaller number can keep you motivated to keep doing the hard yards in the gym.

For those that have a thing for algebra, it looks like this:

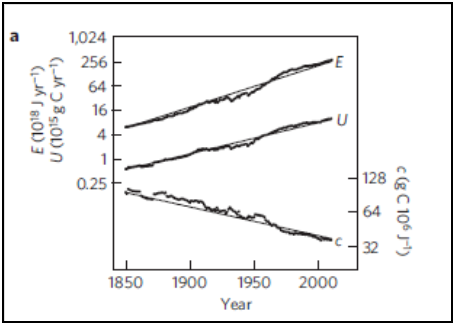
Global anthropogenic CO2 emissions, U (1015 g C yr-1) from fossil fuel and land-use change
lnU = α(t-t1); (α =0.0179±0.0006 yr-1; t1 = AD 1883±1.7)
Global primary energy use, E (1018 J yr-1)
lnE = η(t-t1); (η=0.0238±0.0008 yr-1; t1 = AD 1775±3.5)
Carbon intensity of global primary energy, c = U/E, (g C 106 J-1)
lnc = (α – η)(t-t1)

Energy use and carbon emissions increase, carbon intensity goes down as energy mix changes (from paper)

There’s a positive feedback loop that’s been happening since the Industrial Revolution where greater energy use leads to more human industrial growth, which leads to greater energy use etc and on. Averaged out, it was calculated to be ≈2.4% per year.

The good news is the mitigation rate (the rate that carbon emissions are decreasing from social actions) from changing the mix of energy use in the world and ramping up renewables has increased from ≈3% per year in 1990 to ≈15% per year in 2010 making our growing pollution a little bit less carbon intensive. And modest levels of feedback can make larger impacts in terms of mitigating climate change.

The bad news is, in the scheme of things we’re currently doing squat. We’re getting into the gym and looking at the scheduled hill-climb program and skipping it to just saunter on the treadmill and not break a sweat. In order to meet the targets notionally set in the UNFCCC Durban negotiations in 2011, we’re going to have to be 50 times more effective in how we’re reducing our carbon consumption. Yeah that’s right, I said fifty.

Even worse – while small changes have large effects to begin with, their effectiveness tapers off really quickly. Think about it – the first time you try and run 3km it feels like a marathon. After a few weeks of training, it’s your warm up. And so far, the researchers have found that the climate-society feedbacks have been too weak to change business as usual pollution growth.

So what’s the point? Were they just getting funky with their algebra to make us feel bad about doing nothing? No – there’s a useful application for the relationship between social action and climate mitigation.

Climate change is a moving target. You can never quite be sure exactly how it’s going to play out – it’s non-linear (unpredictable), and the consequences change depending on what we do about it. Which means the more we wake up to the realities of climate change and start actually getting our asses in gear, the more information we’ll need to be able to make policy and business decisions on what to do next.

If you can utilise the climate-society feedback link, then you can analyse how effective the action has been and where the next target should be as it changes – it’s climate change real time tracking in the same way I know I need to pick up the pace in the gym if my last km was slower.

Pick up the pace people- London 2012 Olympic Women’s Marathon (photo: Amy Huva 2012)

As the researchers say in the quote from the top of the blog “the decarbonisation of global energy sources is the only available means of effective mitigation of global CO2 emissions while still allowing society to grow as it has done historically.”

Our choices are – ignore it and hope the reality never hits you (which it will anyway), or get into gear and onto that treadmill. I know which one I’m choosing.

Increased CO2 at the Bottom of the Food Chain – Phytoplankton

WHO: Kunshan Gao, Guang Gao, Yahe Li, Bangqin Huang, LeiWang, Ying Zheng, Peng Jin, Xiaoni Cai, Wei Li, Kai Xu, Nana Liu (State Key Laboratory of Marine Environmental Science, Xiamen University, China)
Juntian Xu (School of Marine Science and Technology, Huaihai Institute of Technology, Lianyungang, China)
David A. Hutchins (Marine Environmental Biology, Department of Biological Sciences, University of Southern California, Los Angeles, California)
Donat-Peter Häder (experimental design and data analysis, Möhrendorf, Germany)
Ulf Riebesell (Helmholtz Centre for Ocean Research Kiel (GEOMAR), Kiel, Germany)

WHAT: Large project in the South China Sea to work out the effects of increased CO2 on important algae

WHEN: July 2012

WHERE: Nature Climate Change, Vol 2 Issue 7 2012

TITLE: Rising CO2 and increased light exposure synergistically reduce marine primary productivity (sub required)

The bottom of the food chain contains the unsexy and somewhat unpopular plants and animals. Let’s face it, most of us are not going to get as worked up over algae as a really cute polar bear. But climate change is going to affect the algae too, so this large project between the State Key Laboratory of Marine Environmental Science in China, the University of Southern California and a centre for ocean research in Germany set out to find out what increased CO2 levels mean for phytoplankton.

Phytoplankton – not as cute as polar bears (Logical Progressions, Flickr)

Phytoplankton are microscopic plankton that we can only see when there’s too many of them and they create an algal bloom. They are part of a larger group of algae, which are the building blocks of the food chain in the ocean and undergo photosynthesis (just like plants do) to create 40% of the primary production (really basic organic compounds) in the ocean.

So while they may not be the coolest things in the ocean, they’re pretty important.

Oceans absorb a really large amount of the carbon pollution we’re currently putting into the atmosphere – around 1millon tonnes of CO2 every hour is absorbed and a quarter of that gets removed from the atmosphere and stored in the ocean. The increasing amount of carbon pollution we’re creating means more and more CO2 is getting absorbed by the ocean, making the ocean more acidic.

Phytoplankton algal bloom in the Ross Sea, Antarctica (NASA Goddard Photo and Video, Flickr)

Acidic oceans are not fun for the local residents. Acid makes shells thinner and reduces the defences of animals that have them, and it bleaches coral, turning the coral white. So, if we ignore the need to reduce carbon pollution and allow 800 – 1000 parts per million (ppm) of CO2 to collect in the atmosphere by 2100, what’s that going to do to the ocean and the algae?

That much atmospheric CO2 will increase ocean acidification by 100- 150% (depending on how much we pollute and interactions with other bio-systems), which is really going to suck if you’re a shell-wearing animal or you hide in coral. It’s also going to affect the ability of phytoplankton to grow and therefore produce the basic organic compounds the ocean needs.

The researchers did controlled lab tests with different levels of CO2 concentrations in sea water (between 390ppm which is what the world is currently at and 1000ppm) and different strengths of sunlight. They then checked these against the experiments conducted in the ocean to make sure their results were realistic.

To a certain point, the increased sunlight and CO2 helps the phytoplankton grow, but beyond that point, the phytoplankton start getting stressed, and in extreme situations even start emitting carbon at night after absorbing it during the day.

Apart from the fact that humanity is really in trouble at the point where the ocean starts releasing carbon rather than storing it for us, an ocean where the building block organisms are stressed isn’t going to be very productive for growing things or living.

Higher CO2 can reduce the ability of phytoplankton to grow by up to 81% depending on how much you stress them, but the more CO2 is present, the less sunlight it takes to stress the phytoplankton and reduce their growth. The decrease in phytoplankton also saw an increase in Haptophytes, which form toxic algal blooms.

The effects of CO2 on the phytoplankton can be kept neutral, but only if the amount of sunlight is kept under 30%, which is impossible outside of a lab. The researchers were not able to work out how these effects on phytoplankton would relate to CO2 absorption and sequestration in the ocean, or food production for the rest of the food chain. However, in a world where we allow 800- 1000ppm of CO2 into the atmosphere, there’s unlikely to be any humans around either, since beyond around 450ppm irreversible positive feedbacks kick in and make our planet seriously non-linear (unpredictable and extreme).

So obviously for our sakes and for the poor phytoplankton too, we should reduce our carbon emissions and not let that happen.

Sea Level Rise and the Effects of Carbon Pollution Reduction

WHO: Michiel Schaeffer (Environmental Systems Analysis Group, Wageningen      University, The Netherlands),
William Hare (Potsdam Institute for Climate Impact Research, Potsdam, Germany),
Stefan Rahmstorf (Potsdam Institute for Climate Impact Research, Potsdam, Germany),
Martin Vermeer (Geoinformatics, Aalto University School of Engineering, Finland)

WHAT: Estimates of sea level rise with different levels of CO2 emission reduction

WHEN: 24 June, 2012

WHERE: Nature Climate Change, Vol 2 Issue 7 2012

TITLE: Long-term sea-level rise implied by 1.5 °C and 2 °C warming levels

One of the consequences of climate change is going to be sea level rise as the globe slowly warms and ice sheets and glaciers continue to melt.

The issue is trying to predict exactly how much sea level is going to rise by and how much we can do about it. This paper was published in June in the journal Nature Climate Change, which is an offshoot of the journal Nature, one of the most highly respected peer reviewed scientific journals in the world.

The researchers used several different scenarios for looking at how sea levels rise with rising temperatures and used what’s called a semi-empirical model to predict the numbers out to 2100 and 2300.

A semi-empirical model is one that combines observed and recorded data (thermometers, tide records) with paleo data (ice cores, fossil records). Since there is only recorded tide gauge data from the previous 130 years, this is not a large enough sample to use for long range predictions. It would be like using one week of training to determine whether I could run a marathon. So the researchers combined the historical data with the recorded data and calibrated to test how realistic the combination was.

Calibrating is where you test something for a single result several times and work out what your error margin is. For example, you could measure three different bottles of Coca Cola you bought at the store, and one might have 600mL, one might have 603mL and the third might have 598mL. They’re all supposed to be 600mL, but since most things have a margin of error, not all are exact.

Same thing for science experiments. The researchers calibrated their data for the years 1000 through to 2006 and found that their results were similar to other scientists who had done similar experiments.

Several scenarios were used; two with no reductions in carbon emissions (from the Copenhagen Accord agreement), two where the earth stays within 2C of warming (one that looks at all polluting gasses – carbon, ozone and sulphur based and one that looks at the delay of emission reductions until 2100), and one where the earth stays within 1.5C of warming (with early carbon emission reductions keeping pollution under 400 parts per million (ppm) in the atmosphere).

Three of the scenarios (delaying until 2100 and two in between) used data that will be included in the IPCC 5th Assessment Report which is the newest data on climate change. The finalised 5th report won’t be published by the UN until the end of 2014.

One of the scenarios for 2C (the one with the different polluting gasses) was developed by an international scientific group and published in Climactic Change. The scenario for 1.5C was developed by a group working for the International Energy Agency and published in the journal Energy. Another hypothetical scenario where global carbon emissions are zero by 2016 was also used to see what effect historical emissions might have on sea levels.

So what did they find? Already, the data for the 20th Century (1900-1999) has higher sea levels than any time in the past 1,000 years.

Using the scenario from the Copenhagen Accord (the equivalent of doing nothing) a sea level rise of 72 – 139cm by 2100 was predicted.

Even with zero emissions by 2016 there’s a predicted sea level rise of 40 – 80cm by 2100. The reason for this is because climate systems are inert. Which means they can absorb a lot of change before you can see it and that there’s a time lag between putting the pollution into the atmosphere and seeing the consequences.

Sea level rise precitions (MERGE400 = 1.5C, Stab2 and RCP3-PD = 2C, CPH = no action, others are variations in between). Dark lines are the median (middle) predictions, shaded areas show the uncertainty range.

So what does this mean in reality for climate change and people? It means that even if we limit carbon pollution in the atmosphere to 400ppm the conservative estimate is for a 54cm rise in sea level, which is knee-deep on me. And if 400ppm doesn’t sound like a very big number, just remember the US EPA recommends that more than .002ppm of mercury in your drinking water is dangerous. You don’t need large amounts of compounds for them to be dangerous to your (or the planet’s) health.

The good news is the research shows that even though there’s uncertainty regarding non-linear (unpredicted) changes in ice sheet melt, and we’re going to experience sea level rise continuing over the next 50 years from pollution already in the atmosphere, emissions reductions do show less sea level rise than the ‘do nothing’ or ‘delay’ scenarios.

So while we are going to have around half a metre of sea level rise in the next 50-100 years (I’d hold off on purchasing that beachfront property), with strong emission reductions, the sea level might peak sometime before 2100 and hopefully head back towards normal.

Why the huge range of numbers and years? Firstly because the researchers can’t say what and how much the world is going to do about climate change in the next few decades, and secondly because you can’t be absolutely (as in 100%) certain that anything is going to happen until it actually does. But the data gives us a pretty clear indication that the year 2100 will see somewhere between .5 – 1m of sea level rise.

Renewable Hybrid Systems: Optimising Power Grids

Image

WHO: Robert Huva, Roger Dargaville and Simon Caine

WHAT: Electrical power grids powered by renewable energy

WHEN: Published in Energy [41 (2012) 326-334]. April 2012

WHERE:  Earth Sciences department, The University of Melbourne, Melbourne, Australia

TITLE:  Prototype large-scale renewable energy system optimisation for Victoria, Australia (subs required)

One of the major barriers to the full scale take-up of renewable energy to power electricity grids has been the need to provide baseload power to users. This is the power required to keep your fridge running through the night, the power to keep traffic lights running all day and night and many other things. It’s the minimum amount of electricity required to keep the modern world running.

Renewable power is not constant, because the sun doesn’t shine at night and it’s not always windy, and water runs through rivers at different speeds depending on the time of year. So in order to provide the constant power needed, a hybrid system of renewable energy sources needs to be used.

This paper from the University of Melbourne in Australia has done that. They used detailed weather maps for the state of Victoria to determine the best locations for solar and wind power.

Victoria, Australia (Google maps)

Best locations for wind (blue) and solar (red)

They then combined the outputs of the solar and the wind with other forms of renewable energy, including hydro-electricity (running water spinning a turbine to make power) and wind-hydro hybrids where excess wind power will pump water up a hill to a raised dam, and when the wind dies down, the dam gets opened and the hydro starts producing electricity.

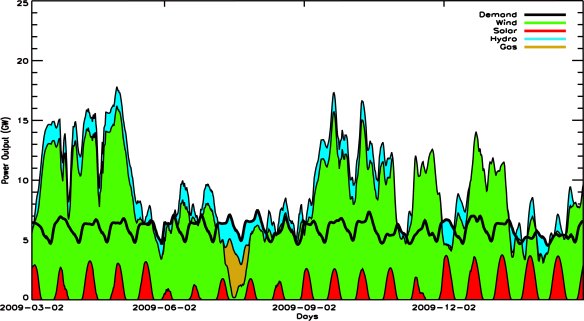
They found that the entire electricity needs of the state of Victoria could be met from renewable power sources with only 2% back up from natural gas needed.

 Hybrid renewable systems – meeting demand

So what does this mean for reducing the effects of climate change?

It means that renewable power is viable in the state of Victoria, which will allow the state to switch from it’s current power source of brown coal (which is much dirtier than your standard black coal when it burns, releasing more carbon pollution into the atmosphere).

Making the transition to a hybrid renewable system will also significantly reduce carbon emissions in the state of Victoria since 49% of energy in the state comes from coal power. It will create a large number of new jobs, as the renewable energy market increases from 12% (in 2011) to the 98% that has been shown in the research, which we will need to do in the next 30 years if we want to avoid catastrophic climate change.

How can it be done? By ensuring areas are able to access either localised power production (in rural or remote areas), or smart grids (in cities) that are able to monitor and respond to changing power production levels and changing energy use levels, hybrid systems of renewable electricity are fully capable of providing the power we need to run our lives.

*Full disclosure: The name is not a coincidence – this research was conducted by my brother as part of his PhD research (yes, I’m using my brother’s research to test out my own blog 🙂 )