IPCC Discovers Infographics – Communicates Climate Change

Working Group II put out their state of the climate for AR5 this March and finally worked out how to communicate climate change.

WHO: The many, many world leading scientific authors of the IPCC – the list is here.

WHAT: Working Group II – the impacts, vulnerability and adaptation group from the IPCC

WHEN: 31 March 2014

WHERE: The IPCC website

TITLE: Climate Change 2014: Impacts, Adaptation, and Vulnerability (open access)

Remember in October 2013, when the first chunk of the IPCC 5th Assessment Report (AR5 for us nerds) was released and I was really snarky about how everyone at the UN speaks a really dense dialect of bureaucrat that almost no-one else can understand and will therefore not bother to read?

Well this time the IPCC got it right! The report from Working Group II who look at the impacts, vulnerability and adaptation humanity will have to do because of climate change discovered colours and infographics and language that normal people actually speak and then used it in their summary for policy makers. They even improved the website to make it more user friendly. Round of applause to the IPCC, the UN Foundation and all the communicators who probably spent many hours de-wonkifying the scientific and bureaucratic language.

The IPCC discovers colour and images (from paper)

The IPCC discovers colour and images (from paper)

This means my job this week was much easier as I don’t even need to translate the 44-page summary for you, but since it’s 44 pages long, I’ll give you the short version.

This time around, the IPCC deliberately went with a risk management frame for communicating climate impacts, and noted that doing something about climate change isn’t really related to the science, so much as it’s a value judgement on how much we’re willing to roll the dice. They do however helpfully point out that ‘climate change poses risks for human and natural systems’ and that it’s being felt in all countries, on all continents and in all the oceans as well. Sorry to burst your bubble if you thought climate change wasn’t going to get you too.

They even put a glossary up the front so you know what they’re talking about when they use words like ‘hazard’, ‘exposure’, ‘vulnerability’, ‘impacts’, ‘risk’, ‘adaptation’, ‘transformation’ and ‘resilience’. Communication high five, IPCC.

Siku the polar bear (image: Polar Bears International)

Siku the polar bear (image: Polar Bears International)

Impacts
So what’s happening so far because of climate change then? Well, it’s a long list of nasty stuff; glaciers are melting, there’s drought, the permafrost is melting and releasing methane. Species are being forced out of their habitat faster than they can move and going extinct and the IPCC can report with a high level of confidence that we’re causing climate change extinctions at a much faster rate than has ever happened with previous natural cycles of climate change.
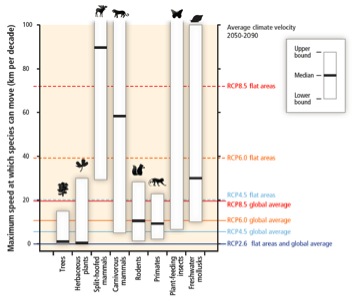
Plant and animal migration opportunities and how far they could get pushed with climate change (from paper)

Plant and animal migration opportunities and how far they could get pushed with climate change (from paper)

Crops are getting more negative impacts from climate extremes than the extra CO2 is helping them grow, and the ability to grow lettuce in Greenland will be a coin toss depending on how good the quality of the soil is at such high latitudes. Climate change is already affecting the yield of wheat, maize, rice and soybean crops.

Climate change is affecting (and will continue to affect) humans too – it’s harming our health through heatwave deaths and increased waterborne diseases. It’s a ‘threat multiplier’, which means it makes stressful situations more dire, like the drought in Syria which was a big factor in the current civil war there.

The authors also point out that vulnerabilities differ because of inequality, which is their nice way of saying that if you’re poor or you live in a poor country; climate change will hit you first. This makes sense from what we’re already seeing of climate impacts and clean up from extreme weather disasters – it’s much harder to plan for climate adaptation when you live in a warzone.

Adaptation
After all that depressing news, they follow up with some good news – what we’re doing to adapt to climate change. They point out that adaptation is becoming embedded into planning processes, so areas will be more resilient to changes. Adaptation knowledge is accumulating in both the private and public sectors and is being incorporated into risk management processes.

They do point out though that adaptation and mitigation choices that are made now will affect the severity of climate change for the rest of the century. No pressure or anything, but if we get this wrong all your grandchildren might hate you for it.

Future risks
Then they get into how bad it could get if we do nothing. Low-lying Pacific Islands go underwater (the first one was actually evacuated last weekend), coastal cities get flooded, people die in storms and heatwaves, food runs short in some places, farmers lose their land from drought and desertification and places we are really fond of like the Great Barrier Reef die too.

But even if you don’t care about the plants, animals or people in far away countries, the IPCC isn’t going to let you off the hook. They point out that human influence on the climate system is clear, and it’s the level of danger to humans that we have to manage.

Then they do get a little wonky and come up with a hilarious acronym: RFC which stands for ‘Reasons for Concern’ (bureaucrats have a deep love of acronyms). What are the RFCs and should they be keeping you up at night?

Well it’s your call to lose sleep over it, but you should be worried about losing unique systems (any natural wonder of the world basically), extreme weather, uneven distribution of impacts (even if climate change doesn’t destroy your home city, where do you think all the migrants from the dustbowl will go?), global aggregate impacts (like ocean acidification killing all commercial fisheries), and abrupt irreversible impacts (hello melting Greenland ice sheet!).

Sensibly, they point out that increased warming puts us at a greater risk of ‘severe, pervasive and irreversible impacts’, and that the cost of adapting to all these scary disasters is much cheaper if we mitigate (you know, stop burning carbon).

Sectoral risks
Just in case you still thought that climate change is not going to affect you, your friends and family, your hometown and your favourite holiday location, the IPCC would like to let you know it’s also going to affect your livelihood and your access to food.

We’re going to have more drought and water shortages, could have abrupt change in the Arctic or Amazon rainforest causing all kinds of disruption to not only carbon storage, water quality and biodiversity but also economic activity.

Coastal populations will be threatened by flooding, fisheries could collapse and ocean acidification already caused the loss of $10million worth of scallops in Canada. We’ll probably get more famines thus wiping out all the great work charities have done to try and end world hunger, and if that wasn’t bad enough, the report says ‘all aspects of food security are potentially affected by climate change, including food access, utilisation and price stability’. Everything is going to get more expensive and harder to source.

Cities will have more heat stress, flash flooding, landslides, air pollution, drought and water scarcity (the difference being that drought is when you’re short on water for your garden, water scarcity is when you’re short on water for people). Rural areas will have more food and water insecurity and could lose their farms and livelihoods to drought.

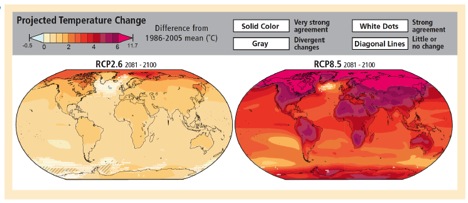
And if that laundry list of destruction wasn’t enough for you, here’s what the IPCC says about their worst case scenario projection (which is what will happen with business as usual): ‘by 2100 for the high-emission scenario RCP 8.5 the combination of high temperatures and humidity in some areas for parts of the year is projected to compromise normal human activities including growing food or working outdoors’.

Yeah, business as usual will make it too hot to go outdoors in some places and you won’t be able to grow any food.

Too hot to go outside – business as usual in 2100 on right (from paper)

Too hot to go outside – business as usual in 2100 on right (from paper)

Building resilience
So now that the IPCC has told us with high levels of certainty that we’re in big trouble and that climate change is going to affect everyone, no matter how much money you have to still import bacon, coffee and avocados, what can we do about it?

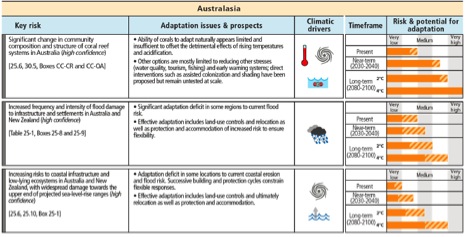
Firstly – coordinate across different levels of government for things like flood proofing and building infrastructure. Use the range of available strategies and actions to make sure communities are reducing their vulnerability – each of the risk bars on the IPCC infographic have a shaded area, which is the amount of risk that can be reduced through adaptation. Make sure planning takes into account diverse interests, circumstances and sociocultural contexts.

Adaptation risk management opportunities for Australia (from paper)

Adaptation risk management opportunities for Australia (from paper)

Some of the really hard conversations around climate change in the future are going to be with communities who will need to relocate or will lose their way of life because of climate impacts. These discussions are both really important and really difficult – we should be planning for that.

The report gives a slight nod to fossil fuel subsides (and the need to remove them) by saying ‘improved resource pricing, charges and subsidies’ which is their way of saying ‘divest, people’.

Also, (and somewhat obviously, but these things need to be said) the success of any adaptation will depend on how much we mitigate. Unless we stop burning carbon, we won’t have anything left we can adapt to – remember, business as usual makes it too hot to go outside and grow food.

So there you have it – the IPCC have kicked a massive goal this time around managing to stop speaking bureaucrat and start communicating with people. Kudos where it is deserved. Working Group III have their report coming out next week, so we’ll see if they can keep up the great work.

In the mean time, let’s stop burning carbon.

Show me the Money: Adaptation Finance

Cities and poor people living in cities are often forgotten in climate adaptation planning. How can we fix that?

WHO: Barry Smith, International Institute for Environment and Development (IIED) Climate Change and Human Settlements Group
Donald Brown, Independent Researcher
David Dodman, Senior Researcher, IIED Human Settlements and Climate Change Group; Team Leader, Cities and Climate Change

WHAT: A look at how adaptation finance can better serve poor communities, especially in cities

WHEN: January 2014

WHERE: IIED website

TITLE: Reconfiguring urban adaptation finance (open access working paper)

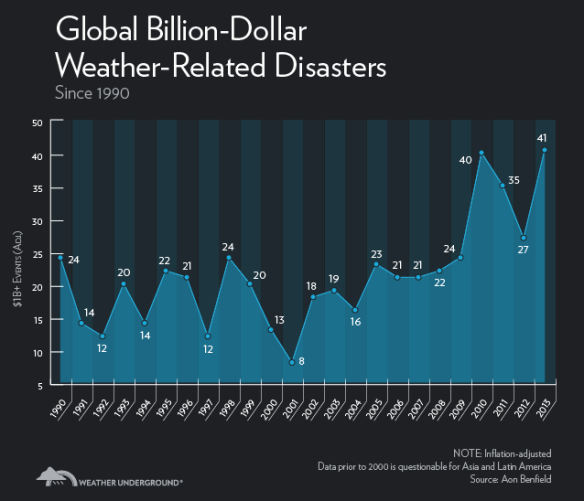
Climate change adaptation is expensive – more expensive than mitigation as the USA discovered last year when it broke a record for billion dollar disasters and spent more on disaster recovery than health and education combined. Unfortunately, the people who are most vulnerable to climate extremes are poor people who tend to live in areas that are less secure, have worse infrastructure, less access to finance and legal protection and less ability to move when a storm wipes out their neighbourhood.

Billion dollar disasters – they’re a growth industry right now (from Jeff Masters, Weather Underground)

Billion dollar disasters – they’re a growth industry right now (from Jeff Masters, Weather Underground)

This paper looks at adaptation in cities in developing countries that have large informal settlements like slums, but as Hurricanes Katrina and Sandy both showed, these issues are going to affect populations around the world, regardless of where you live.

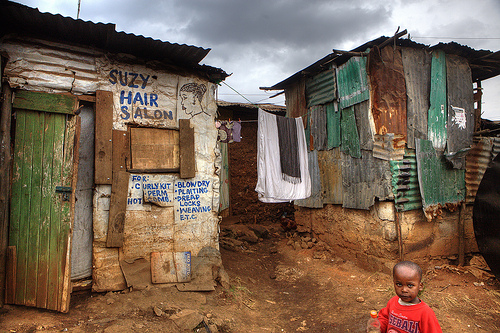
However, in developing countries, the issue is on a larger scale. As the authors of this paper point out, slums are often built in hazard-prone areas, and because cities don’t want to admit they have problems with poverty and slums, they don’t get counted and often get ignored when climate adaptation is planned.

Issues with infrastructure and utilities – Kibera slum in Nairobi (Norvartis, flickr)

Issues with infrastructure and utilities – Kibera slum in Nairobi (Norvartis, flickr)

Currently, urban adaptation finance involves many international organisations (your top-down approach) as well as local organisations. The international ones are international NGOs, the World Bank and the UN through the UNFCCC (UN Framework Convention on Climate Change). One of the risks with this system is that instead of cities and countries getting new funding for adaptation, they could just get old funding ‘re-labelled’ as adaptation funding, which won’t work. The authors also point out that adaptation funding is required to be new and additional, which makes sense because climate impacts are also new and additional. Regular investments through international adaptation funding also need to be ‘climate proofed’ which could be called ‘because climate change will affect everything, it needs to be built into all decision-making processes’.

There is definitely an important role though, for NGOs to do this and ensure that including climate change in decision-making is mainstreamed, at which point it’s finally not just me being the weirdo at the party asking people how far above sea level their home is.

No seriously, how far above sea level is your house? (Nick Hewson, flickr)

No seriously, how far above sea level is your house? (Nick Hewson, flickr)

UNFCCC processes are (unsurprisingly) labyrinthine and difficult to get money out of. They have a special climate change fund (which gets shortened to SCCF because everything is an acronym at the UN), which has $239 million, but so far it’s been slow on the spending of that adaptation fund. This is because the fund has a governing council that represents the polluting countries (that’s us – the industrialised developed countries that are responsible for most climate change) more than the developing countries, giving the polluting countries an effective veto over the money.

The UNFCCC also has an Adaptation Fund, which is funded by a 2% levy on clean development mechanism projects. It’s more transparent, developing countries have more of a seat at the table and the process also includes NGOs, however the fund is comparatively smaller at $151million.

The World Bank has a Pilot Program for Climate Resilience (PPCR) which as a pot of $1billion for climate adaptation. The World Bank has only handed out $8million so far, so there’s some kind of disconnect happening there. The authors suggest that it’s because the planning processes for the projects are required to be between 3 – 18 months long. Which is fine for a project when everyone has agreed what you’re working towards, but when you’re doing climate change adaptation and you need to sit down with a community and explain to people why they might need to leave the place that their family has lived for generations because sea level rise will inundate them, that’s a longer, more difficult conversation.

National systems for funding climate adaptation are more successful at getting the money on the ground and working towards change. Some governments have been early leaders in climate adaptation funds, most notably Rwanda who started their National Climate and Environment Fund in 2005. Way to get ahead of the pack Rwanda! They were recently granted £22.5million from the British Department for International Development, which makes their fund the largest climate fund in Africa.

National adaptation funds give better access to funding for municipalities and local/regional governments. Which makes sense – it’s easier to apply for funding through an organisation you know that speaks the same language than to try and work out where you fit within the World Bank or the UN. However, the authors point out that strengthening the capacity of local organisations working on adaptation in cities could actually be the most effective spend of adaptation money. Why? Because cities are on the ground and have control over things that can make an impact like transit and sea walls and pipes and power lines and garbage collection and disposal. Things that are too local for an international organisation to deal with.

For example, microfinance has been a huge success as a ‘bottom up’ approach to funding adaptation and capacity in communities. Female-led savings groups in poor communities have linked together with groups like Urban Poor Fund International, Slum Dwellers International and the International Institute for Environment and Development (the organisation that commissioned this paper).

By their powers combined, these groups have coordinated pooled savings funds across 464 cities with successes across the globe including places like Malawi. The Malawi Homeless People’s Federation formed a Center for Community Organisation and Development where they coordinated and helped out local savings groups that generally comprised between 30-70 members of a neighbourhood. They also organised ‘exchange visits’ where people from an established savings group would go to a different neighbourhood to tell them about the program and help them set up their own savings group, creating stronger community links within the cities. They now have savings groups across 28 urban and rural centres in Malawi, with over $148,000 in savings, which is phenomenal.

The challenge is then, to connect these two processes – the local and sub-national projects that have connections within the community are the successful ones, and the international organisations are the ones with all the adaptation funding. How can we get them talking to each other so we can start working towards more resilient communities?

The authors suggest the biggest problem is how difficult the international programs are to navigate, with a mismatch between the fiduciary responsibilities and level of reporting at the international level and the ability for poor communities to have the capacity to complete that reporting. Because unless you speak bureaucrat, it can be almost impossible to fill out those forms. Also, international NGO and aid programs often work at a very high level and are often not directly accountable to the communities they work in.

So what should we do? The authors suggest re-tooling the international aid process a bit – focusing on smaller grants ($1,000-$3,000 goes a long way in small communities), focusing on cities and climate adaptation on the ground as key points of adaptation, and encouraging private investment options that include social impact bonds. It’s going to take work, but since we haven’t stopped burning carbon yet, we’re going to need to do it.

The Coffee Grower’s Paradox

Do climate change adaptation programs just shift climate vulnerability?

WHO: Aaron Atteridge and Elise Remling, Stockholm Environment Institute, Stockholm, Sweden

WHAT: Looking at the example of Colombian coffee growers to see if climate change adaptation projects shift vulnerability instead of fixing it.

WHEN: December 2013

WHERE: The Stockholm Environment Institute website

TITLE: The Indirect Effects of Adaptation: Pathways for Vulnerability Redistribution in the Colombian Coffee Sector (open access)

I love coffee and one of the things that really terrify me about climate change (other than the devastating droughts, diseases, storms, and lack of food) is that I might be forced to give up my daily caffeine habit. So naturally, I was interested to find out whether programs that were trying to promote adaptation in the coffee industry in Colombia (home of the worlds best quality Arabica beans) were hindering more than they were helping.

Coffee – we love it (photos: Amy Huva)

Coffee – we love it (photos: Amy Huva)

These researchers set out to look at the unintended consequences of adaptation – are we fixing the problem, or just making it someone else’s problem?

First, they needed to work out what could be vulnerable to change (not just climate change). The increasing globalisation of the world means that your coffee farm is no longer your own little island – it is affected by global prices, supply chains, and the connections between the people involved in all of those activities.

The researchers narrowed it down to five different categories:

  1. Natural capital (aka the ecosystem services you get from trees purifying your air, water feeding your soil etc.)
  2. Physical capital (how many coffee plants do you own? How many tractors does that require?)
  3. Social capital (strong family ties and community ties in the farming industry)
  4. Financial capital (how easy is it for the farmer to access capital to expand/improve their business?)
  5. Human capital (how educated is the farmer? How many local educated workers are nearby she can employ?)

From those categories, the researchers made a case study from interviews conducted with people in the coffee industry in Colombia in 2012. They interviewed farmers, buyers, representatives from the National Coffee Federation (Federación Nacional de Cafeteros), people at the national coffee research institute, federal and local government representatives as well as coffee pickers employed in the industry.

Aside from the fact that Colombia having a national institute dedicated to studying coffee being the most exciting thing I’ve heard all week (can I go visit? How do I donate to fund their research? Can I be a coffee scientist too?), the Colombian coffee industry is surprisingly large.

Coffee has been grown in Colombia for around 200 years and is still overwhelmingly run by small landholders, with 96% of farms being 1.6hectares or smaller. The National Coffee Federation not only represents over 500,000 farmers, but they have a national fund set up similar to Norway’s oil royalty future fund which uses profits from the coffee industry to benefit Colombians. Around 4million people in Colombia make a living from the coffee industry, and between 1964-2012 there were also 170 different international development projects hosted there.

I knew my coffee habit was a good thing!

Coffee science/tastings (photo: Amy Huva)

Coffee science/tastings (photo: Amy Huva)

From their interviews, the researchers worked out that the sources of vulnerability in the industry were pretty much the same as any other industry – price and price volatility, access to markets, access to finance, harvest and yield changes, production costs and knowledge of alternative/more efficient practices.

This means that many of the pressures Colombian coffee farmers are facing are exactly the same problems many other industries are facing like changes in market preference (organic coffee production possibly outstripping demand), or international development aid being used on things that are not a priority for the farmers. This led the researchers to conclude that unexpected flow-on effects are pretty much the norm, not the exception to the rule.

The difference for coffee growers in Colombia is the direct effect climate change will have on them as the prime coffee growing conditions move to higher latitudes where the soil is not as fertile.

The key risk for adaptation programs looking at climate change is that farmers in areas that are now marginal for growing coffee will get ignored or abandoned, when they’re the ones that really need the help to either diversify their crops or find new livelihoods as climate change really bites.

So the moral of the story seems to be that while climate change is going to affect the way we all do things, if we’re going to try and help with adaptation, we can’t forget the marginal growers.

Stinking Hot Down Under

The numbers are in: 2013 was the hottest year on record in Australia since records began.

WHO: Will Steffen, Australian National University, Canberra Australia

WHAT: A report on how many heat records were broken in Australia last year

WHEN: January 2014

WHERE: The Climate Council website

TITLE: Off the Charts: 2013 Australia’s Hottest Year (open access)

Last week in Australia it was stinking hot. I was texting with my brother (who is doing a PhD in Meteorology so is also a massive nerd like me) about the heatwave forecast and we came up with a new term for what an overnight minimum temperature should be called when it’s too high. We decided that an overnight low of 28.6oC should be called a ‘lower maximum’ because that’s too hot to sleep in.

Unfortunately, this is the new normal for Australia, which has just been shown in excellent infographic form by the Australian Climate Council. It was a banner year for Australia last year breaking all kinds of heat records and having the hottest average temperature since record keeping started in 1910.


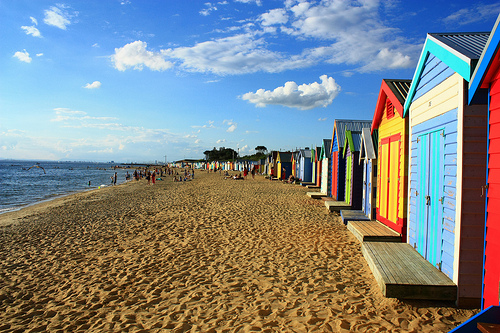
It looks pretty, but it’s so hot the sand burns your feet. Mornington Peninsula, Vic (photo: Amy Huva)

It looks pretty, but it’s so hot the sand burns your feet. Mornington Peninsula, Vic (photo: Amy Huva)

Now, I know we Australians are a competitive people who always like to win, but breaking these records are not so much fun.

Nationally, the records broken were:

  •  Highest average temperature across the country 1.20oC higher than the 1961-90 baseline years
  • Highest mean maximum temperature across the country 1.45oC above the baseline years
  • Mean minimum temperature across the country of 0.94oC above baseline years
  • Hottest January on record
  • Hottest summer on record (Dec 2012-Feb 2013)
  • Hottest winter day on record – August 31st 29.92oC
  • Hottest September on record of 2.75oC above baseline
  • Hottest spring on record
  • Hottest December on record

Locally, some of the notable records were:

  • South Australia broke their spring monthly average temperature record by 5.39oC
  • New South Wales broke their spring monthly average temperature record by 4.68oC
  • Alice Springs had their hottest October day ever of 42.6oC
  • Canberra’s October was 2.5oC above average
  • West Kimberly in Western Australia was a shocking 4oC above average for October

Sea Surface Temperatures were record highest for January and February 2013 and of the 21 days Australia has ever had with a country-wide average temperature above 39oC there were 8 of them in 2013 and 7 of them happened consecutively in January 2013! Remember in the news when Australia had to create a new colour on their temperature maps? That was then.

Even worse, this extreme heat was not pumped up with the influence of El Niño, which normally makes years warmer. The year had no strong El Niño or La Niña effect, so it was a climate-changed year.

Since 1950, the number of heat records has beaten the cold records in Australia at a rate of 3:1 and in true Australian style; we’ve exceeded expectations and broken all kinds of records. This is the new normal, and it’s only going to get worse unless we stop burning carbon.

Infographic by the Climate Council.

Infographic by the Climate Council.

Send in the Clouds

The influence of clouds is one of the big uncertainties for climate sensitivity.

WHO: Steven C. Sherwood, Climate Change Research Centre and ARC Centre of Excellence for Climate System Science, University of New South Wales, Sydney, Australia
Sandrine Bony, Jean-Louis Dufresne, Laboratoire de Météorologie Dynamique and Institut Pierre Simon Laplace (LMD/IPSL), CNRS, Université Pierre et Marie Curie, Paris, France

WHAT: Measuring evaporation, humidity and temperature change in the lower troposphere

WHEN: 2 January 2014

WHERE: Nature, Vol 505, No. 7481

TITLE: Spread in model climate sensitivity traced to atmospheric convective mixing (subs req)

The big question for many people in climate science is what happens when we double the concentration of CO2 in our atmosphere? Is it good and plants grow more? Is it bad and we all die in the next mass extinction? Is it somewhere in between and maybe we’ll be ok?

Most climate models estimate between 1.5oC and 4.5oC of warming for the doubling of CO2, but as I’ve blogged before there’s a huge difference between the consequences of 1.5oC and 4.5oC. So how do we narrow this down for a more accurate model?

These scientists from Australia and France decided to measure the drying effect of cloud mixing to try and sort it out.

Cloud feedbacks are one of the unknowns in climate models – they’re constantly changing, their impact is localised, but overall they have a big impact. They also have different impacts at different levels. High clouds, which are 8km above ground (or at 400hPa pressure) play a minor role in feedback, because at that level of the atmosphere, the temperature isn’t changing that much – it’s happening in the lower atmosphere because that’s where we’re spewing all our carbon pollution (incidentally, warming in the lower atmosphere and lack of warming in the upper atmosphere is one of the ways we know humans are causing current climate change).

Mid level clouds (from 3km-8km) have medium levels of climate feedbacks, but the low clouds – below 3km (750hPa pressure) are capable of strong feedback. Because of this, these researchers decided to measure the low clouds.

Obligatory cloud photo (photo: Amy Huva)

Obligatory cloud photo (photo: Amy Huva)

The evaporation that increases as the temperature warms could lead to more clouds forming, however on the other hand a warmer climate could mean more dry air is drawn to the surface which doesn’t allow the clouds to form. Which one is it?

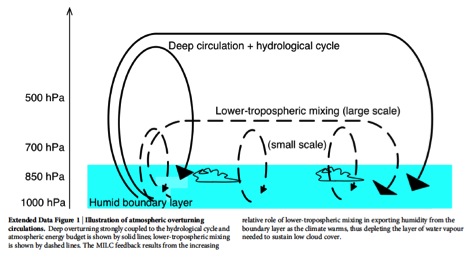
Firstly, cloud mixing. 2km above sea level there is a cloud boundary where a specific type of cloud mixing takes place. This is called ‘lower tropospheric mixing’ which sounds to me like a drink I’d order on a summer beach holiday. What it actually means is a mix of downdrafts of wind, local evaporation of rain and the transportation of shallow clouds. There is large scale mixing which happens via specific circulations, and there’s small scale mixing which is much more varied and localised.

Cloud mixing at the boundary layer (from paper)

Cloud mixing at the boundary layer (from paper)

The researchers measured each type of mixing (small scale and large scale) separately to see whether they would dry out with increased temperatures or not. They measured the temperature and humidity change as well as drying between 700hPa and 850hPa pressure to work out the method of mixing involved.

From the 48 different models they looked at – those that got warmer also got drier. For the small scale mixing, with 4oC of warming, the drying increased by 6-30% compared with only 8% on land. This means that while the land surface is experiencing smaller amounts of drying, clouds are drying out faster. So if you think the drought is bad – it’s worse for the poor clouds.

For the large scale mixing, the researchers looked at monthly data from 10 different models and from applying temperature, humidity and drying to climate sensitivity were able to account for 50% of the variance in system cloud feedbacks! Considering they started their research project saying that ‘no compelling theory of low cloud amount has yet emerged’ I’d say that’s a very successful experiment.

The bad news is they also found with large scale mixing that for every degree Celsius of warming, drying increased by 5-7%. They also found that moisture transport increases strongly with warming, but further research will be needed to work out why that happens (yay science! Discovering new things!).

So this means that from their models with increased accuracy of cloud feedback measuring, a doubling of CO2 in the atmosphere shows a sensitivity of 4oC warming, with a lower limit of 3oC. The researchers found that anything less than 3oC of warming did not line up with cloud observations for that concentration of CO2. The researchers point out that you can’t rule out something weird happening in nature that could change the process suddenly (those scary tipping points), but the process they found was this:

Lower tropospheric mixing dries out the boundary layer by 5-7% per degree of warming because of stronger vertical water vapour gradients, which lead to surface evaporation increases of 2% per degree of warming.

While it’s good to know with more certainty the impacts of doubling CO2 in the atmosphere, unfortunately this time it’s not good news. The way to solve this problem? Stop burning carbon before we’ve doubled CO2.

Our Fast-Paced Modern Climate

How can we determine dangerous levels of climate change so that we can stay within those limits?

WHO: James Hansen, Makiko Sato, Jeffrey Sachs, Earth Institute, Columbia University, New York, USA Pushker Kharecha, Earth Institute, Columbia University, New York, Goddard Institute for Space Studies, NASA, New York, USA
Valerie Masson-Delmotte, Institut Pierre Simon Laplace, Laboratoire des Sciences du Climat et de l’Environnement (CEA-CNRS-UVSQ), Gif-sur-Yvette, France
Frank Ackerman, Synapse Energy Economics, Cambridge, Massachusetts, USA
David J. Beerling, Department of Animal and Plant Sciences, University of Sheffield, South Yorkshire, UK
Paul J. Hearty, Department of Environmental Studies, University of North Carolina, USA
Ove Hoegh-Guldberg, Global Change Institute, University of Queensland, Australia
Shi-Ling Hsu, College of Law, Florida State University, Tallahassee, Florida, USA
Camille Parmesan, Marine Institute, Plymouth University, Plymouth, Devon, UK, Integrative Biology, University of Texas, Austin, Texas, USA
Johan Rockstrom, Stockholm Resilience Center, Stockholm University, Sweden
Eelco J. Rohling, School of Ocean and Earth Science, University of Southampton, Hampshire, UK Research School of Earth Sciences, Australian National University, Canberra, ACT, Australia
Pete Smith, University of Aberdeen, Aberdeen, Scotland, United Kingdom
Konrad Steffen, Swiss Federal Institute of Technology, Swiss Federal Research Institute WSL, Zurich, Switzerland
Lise Van Susteren, Center for Health and the Global Environment, Advisory Board, Harvard School of Public Health, Boston, Massachusetts, USA
Karina von Schuckmann, L’Institut Francais de Recherche pour l’Exploitation de la Mer, Ifremer, Toulon, France
James C. Zachos, Earth and Planetary Science, University of California, Santa Cruz, USA

WHAT: Working out what the limit to dangerous climate change is and what the implications are for the amount of carbon we need to not burn.

WHEN: December 2013

WHERE: PLOS One, Vol 8. Issue 12

TITLE: Assessing ‘‘Dangerous Climate Change’’: Required Reduction of Carbon Emissions to Protect Young People, Future Generations and Nature (open access)

This (very) lengthy and detailed paper runs us all through exactly what’s happening with the planet’s climate, what’s making it change so rapidly (spoiler: it’s us) and what objectively we need to do about it. Needless to say, since the lead author is Dr. James Hansen, the godfather of climate science, we would do well to heed his warnings. He knows his stuff; he was doing climate models before I was born (seriously).

Firstly, the paper points out that humans are the main cause of climate change and then also neatly points out that while all 170 signatories to the UN Framework on climate change (UNFCCC) have agreed to reduce emissions, so far not only have we not worked out what the limit for ‘dangerous’ climate change is, we’ve also done nothing to fix it except fiddle at the edges.

Epic procrastination fail, humanity.

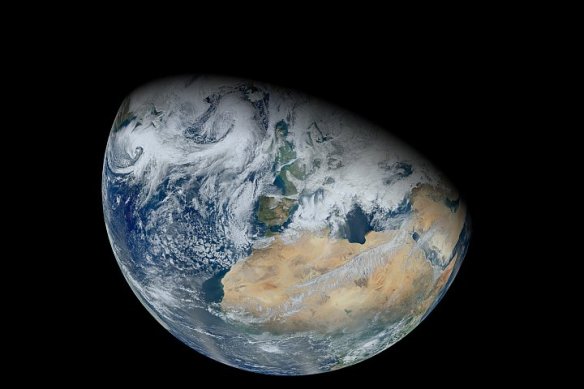
One planet, different ways to reach zero emissions (Norman Kuring, NASA GSFC, using data from the VIIRS instrument aboard Suomi NPP)

Norman Kuring, NASA GSFC, using data from the VIIRS instrument aboard Suomi NPP

Then, the researchers look at 2oC warming as a target. In reality, while 2oC is a nice, seemingly round number that is far enough away from our current 0.8oC of warming, the reason it was randomly chosen to be our line in the sand is that it’s the point beyond which ecosystems start collapsing. I have a sneaking suspicion it was also easy to agree on because it was way into the ‘distant’ future, but let’s play nice and believe it was all for rational scientific rigour.

The latest IPCC report says that if we’re going to stay below 2oC, we can burn a total of 1,000GtC (Gigatonnes of carbon). Ever. This means we need to leave fossil fuels in the ground and stop cutting down more trees than we plant.

As has been pointed out in previous papers, the researchers show that burning all the fossil fuels is a really bad idea. A really bad idea in a mass extinction like the dinosaurs kind of way.

So, if we look at all the warming that has happened so far and measure the energy imbalance in the atmosphere, what do we get? Firstly a step back – energy imbalance. This is your energy budget where you always want it to be constant. Energy comes into the atmosphere from the sun, some goes back out, some stays and keeps us warm and comfy on planet Earth.

Fossil fuels mean that humans have taken a seriously large amount of energy out of the ground and burned it. Releasing this energy into the atmosphere means we’ve now got too much energy inside our atmosphere and we’re out of balance.

What happens when we’re out of balance? Well, so far it hasn’t been pretty. With only 0.8oC of global warming 98% of Greenland’s surface melted for the first time in recorded history, Arctic sea ice hit new record lows, the planet has seen more frequent more extreme storms, floods, typhoons, hurricanes, droughts, fires, algal blooms, glacial melt, and ocean acidification. We’ve had weird storms no-one has ever heard of before like Derechos, we’ve had tropical diseases in new places, and the Jet Stream over the Northern Hemisphere getting ‘stuck’ and dumping more weird weather on us. It’s pretty clear the planet is unwell and that it’s because of us.

you have humans

If all that terrifying stuff is happening at 0.8oC of warming, what does that make 2oC? Hopefully your answer is ‘horrifying’, because that’s what my answer is. Since 2050 (when we’ll arrive at 2oC if we keep going business as usual) is within my working lifetime, I’ll let you know how horrifying it is when we get there.

More scientific than ‘horrifying’ though, the researchers point out that previous paleoclimate changes, from the Earth’s tilt and other slow oscillations took between 20,000 – 400,000 years to happen. Changes happening at that rate give the plants and animals and fish time to relocate and survive. The rate at which we’re changing our modern climate is bad news for things that are not mobile.

How far out of balance are we? The paper estimates that between 2005-2010 the planet was 0.58 W/m2 (± .15W/m2) out of balance. How much of that was caused by humanity? Well, solar irradiance has been going down over the last while, so it’s pretty much all us.

If we are 0.5 W/m2 out of balance, the researchers calculate that we would need to reduce the CO2 concentration down to 360ppm to have energy balance again (we’re currently at 395ppm). If you include some error in the calculations and we’re 0.75W/m2 out of balance, humanity needs to get CO2 down to a concentration of 345ppm.

To make planning easier, the researchers suggest we just aim to get and stay below 350ppm.

The paper then runs through all the reasons why 2oC is a really bad idea to let happen. Because it will lead to damaging sea level rise (sorry Miami), because change is happening too quickly for many species to survive and more than half the species on the planet could go extinct from too much warming (and yes, if we warm this planet enough, humans could be part of that mass extinction).

Because the recovery back to normal temperatures happens on a timescale of millions of years which is beyond the comprehension of humanity.

So to avoid being the next mass extinction, what do we need to do? First, we need to quantify how quickly fossil fuels need to be totally phased out.

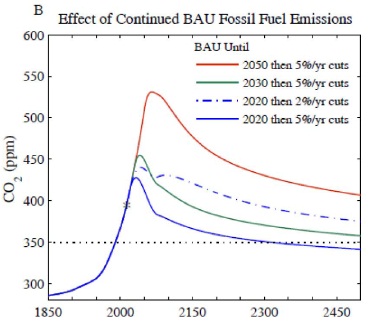
If emissions are reduced to zero in 2015, the world could get back to 350ppm by 2100. If we wait until 2035, it would take until 2300. If we wait until 2055, it would take until the year 3000. So when we start reducing emissions is important.

Reduction scenarios (from paper) BAU: Business As Usual

Reduction scenarios (from paper) BAU: Business As Usual

If we had started reducing emissions in 2005, it would only have taken reductions of 3.5% per year. Since we didn’t do that, if we start now, we need to reduce emissions by 6% a year. If we delay until 2020 it becomes 15% per year, so let’s not procrastinate on this one humanity. Also keep in mind that the amount that is considered ‘politically possible’ is currently around 2-3% reductions each year, which means that scientific reality and political delusions are going to collide very soon.

If we reduce our carbon emissions by 6% per year to keep below 350ppm of carbon dioxide by the end of the century, our total carbon budget is going to be 500GtC.

This means we’ve got ~129GtC that we can burn between now and 2050, and another 14GtC left over for 2050-2100. Humanity has already burned through ~370GtC from fossil fuels, so we’ve got to kick this habit quickly.

The paper points out that this means all of our remaining fossil fuel budget can be provided for by current conventional fossil fuels. Therefore, we would require the rapid phase-out of coal and leave all unconventional fossil fuels in the ground. Yes, all of them – all the tar sands, the shale gas, the shale oil, the Arctic oil, the methane hydrates, all of it.

The researchers also say that slow climate feedbacks need to be incorporated into planning, because we’re probably starting to push those limits. Slow feedbacks include things like melting ice sheets (Greenland and Antarctica), deforestation, melting permafrost and methane hydrates.

These things are like climate ‘black swans’ – they’re unquantifiable in that you don’t know when you’ve passed the irreversible tipping point until after you’ve gone beyond it, but things like the ocean no longer being able to absorb most of the carbon we spew into the atmosphere and the rapidly melting permafrost need to be considered in daylight as well as our nightmares now. This is because slow feedbacks can amplify climate changes by 30-50% which puts a big hole in our ‘not burning carbon anymore’ plan.

The paper points out: ‘warming of 2oC to at least the Eemian level could cause major dislocations for civilisation’ which I don’t even need to translate from scientist, because scientists are no longer bothering to pull their punches when explaining how quickly we need to stop burning carbon before we’re really screwed.

So what do we do? The paper makes some suggestions, pointing out that since the science clearly shows what’s happening, the range of responses is also pretty clear.

The first thing is a price on carbon. This paper suggests a carbon ‘fee’ with a border levy for countries that don’t sign up to the fee idea. The fee starts at $15/tonne of carbon and increases by $10/tonne each year. Imports from countries that don’t have the fee get charged at the border, which can then be used for assistance to industries that are exporting to countries without the fee.

They point out that this fee is below the price of cleaning up our climate carbon mess. If we wanted to pay to sequester 100ppm of CO2 out of the atmosphere, it would cost ~$500/tonne of carbon. If that was charged to all countries based on their cumulative emissions, that would be a cost of $28 trillion for the USA (or $90,000 per person) who is responsible for 25% of cumulative global emissions. Hmmm – expensive.

The other things we need to get rid of fossil fuels are hybrid renewable smart grids and better efficiency as well as not only an end to deforestation but ‘reforestation’ and increasing the amount of trees on the planet.

There’s a lot of work to be done, but the clearest thing from this paper is the choice we cannot make is to do nothing. So let’s stop burning carbon.
Zero Emissions by 2050

Is it feasible to have zero greenhouse gas emissions by 2050? Yes!

WHO: Niklas Höhne, Pieter van Breevoort, Yvonne Deng, Julia Larkin, Gesine Hänsel (ECOFYS Consultants, Köln, Germany)

WHAT: Looking at the technical and economic feasibility of having zero greenhouse gas emissions by 2050

WHEN: 2 October 2013

WHERE: On the ECOFYS website

TITLE: Feasibility of GHG emissions phase-out by mid-century (open access)

Is it technologically and economically doable to have zero carbon emissions by 2050 so that we can avoid an unlivable climate? Yes! Huzzah – easiest and shortest blog post ever. Let’s have a glass of wine and go home.

Huzzah! Some climate good news! (Joe Penniston, flickr)

Huzzah! Some climate good news! (Joe Penniston, flickr)

For those of you that don’t just want the tl;dr version, here are the details. The German environmental consulting firm ECOFYS set out to find out if it was doable to have zero GHG emissions by 2050 and it is.

It’s going to take some serious restructuring of how we do things and the systems we use, but we can get 90% of the way there with current technologies and it will cost around 5% of a country’s annual GDP each year.

If that sounds like a lot of money (which it is), consider that the globe currently spends around 3% of annual GDP subsidising fossil fuel production each year. So if we removed fossil fuel subsidies and made them compete on a level playing field with renewable energy, it will practically be cheap!

The authors of the paper also point out that while that’s what the estimated costs are now, the longer we wait to get going on reducing emissions the more expensive it is (and that’s before the billions of dollars extreme weather disaster clean ups cost get factored in).

Ok, so restructuring – what exactly does that entail? It involves changes to the systems that we use to do things. The first big one is energy systems, which account for two thirds of our fossil fuel emissions and the first change that takes a big chunk out of our emissions is electrification.

Because there is no ‘silver bullet’ material to replace oil, moving things that use oil over to electricity makes it easier to decarbonise, because you can take a hybrid-renewable electric grid and feed lots of different kinds of power into it.

Industry and industrial systems account for 30% of the world’s carbon pollution. The fastest way to decarbonise those is through circular manufacturing processes that reuse and recycle 100% of their inputs, which is already being worked on at the Ellen MacArthur foundation. We will also need to be more efficient with things like co-generation where you use waste heat (like the heat in your shower water when it goes down the drain) to heat buildings.

The False Creek Neighbourhood Energy Utility in Vancouver

The False Creek Neighbourhood Energy Utility in Vancouver (City of Vancouver)

These ideas will get industry about 95% of the way off our carbon habit, so the gap will need to be closed with some extra innovation before 2050, which I’m sure humanity is capable of.

Buildings are about 20% of the world’s carbon emissions. The way to decarbonise the existing buildings is to retrofit them to high efficiency standards. In order to do this by 2050, we’ll need to be renovating existing building stock at a rate of 2-3% each year (which the authors say has been demonstrated as an achievable rate).

Because buildings have a long lifespan of decades, the other really important thing is to make sure there are new building standards where all new buildings need to be as close to carbon zero as possible and powered by zero emission sources.

The other areas buildings can be more efficient is to make sure they’ve got efficient appliances in them, and efficient stoves which reduces black carbon (soot) pollution.

What about transport? It accounts for about 15% of global emissions, and one of the first things we can do to make transport less carbon intensive is to have better Urban Planning. Good news – when you have walkable and bikeable urban areas people drive less and take public transport more often!

My kind of bikeable (photo: Amy Huva)

My kind of bikeable (photo: Amy Huva)

All vehicles will need better efficiency standards – all road vehicles, rail transport, air transport and shipping. Passenger and freight transport needs to be switched to zero carbon options.

Here’s the bit I really like – 100% electrification of individual road transport and rail transport. Think of how much nicer cities will be to walk around when they’re full of electric cars! No more nasty noisy traffic, because the internal combustion engine is last century’s technology and hot cars like a Tesla are the future.

Not the future (Simone Ramella, flickr)

Not the future (Simone Ramella, flickr)

For the transport that cannot be electrified like international shipping and air travel, advances in biofuels will get us there by 2050.

Power supply covers about 5% of global emissions, but coal power plants are nasty, dirty, toxic things. So naturally the first step there is to rule that any new power plants get built with carbon capture and storage or not at all. Carbon capture and storage will also be important for biomass, but interestingly, the paper says that nuclear power is not essential for electricity generation.

Dirty coal is not your friend – it’s so two centuries ago (Steve Jones, flickr)

Dirty coal is not your friend – it’s so two centuries ago (Steve Jones, flickr)

What is essential for electricity decarbonisation is smart grids. We need a more efficient electrical grid, and unless we know how much power people are using, we can’t meet demand at the times they need it.

Agriculture contributes 25% of global greenhouse gas emissions (and it’s not just from cow fart methane either). The first thing that needs to happen is the end of deforestation. Cutting down trees means not only that the carbon gets released from the tree, but also that tree is no longer in service sucking in carbon dioxide and giving us back oxygen. We really need trees on the job of sucking up carbon, so we need to stop cutting them down.

Keep the carbon sequestering worker-trees! (ljhar6, flickr)

Keep the carbon sequestering worker-trees! (ljhar6, flickr)

Next we need to enhance the amount of carbon sequestered in soils. There’s a whole heap of new farming techniques that help keep moisture in the soil and retain the nutrients to reduce inorganic fertilizer use, so keep up the good work farmers!

Next, us city people need to stop wasting so much food. It’s estimated at 40% of the food produced globally gets wasted. So we need to stop doing that and stop putting food scraps into landfill where it produces methane. Start composting, people.

You know you want to... (Kirsty Hall, flickr)

You know you want to… (Kirsty Hall, flickr)

Another suggestion the paper had was to make sure all wastewater (the water you flush) gets treated with anaerobic digestion, so the methane can be collected and used to heat things.

With a long list like that it sounds expensive, right? It will be. But you know what’s going to be more expensive? Doing nothing. Business as usual will force us to pay huge amounts to adapt to continued and diversifying climate disasters, which will cost anywhere between 5-20% of global GDP every year depending on how unlucky you are. You could get ‘lucky’ and only have to clean up from an extreme weather event once a year, or you could get unlucky and have drought followed by floods, followed by a storm, followed by weird snow, unprecedented forest fires, etc. The list is scary, long and very, very expensive.

So what do we need to do to make all of this start steamrolling forward? We need a price on carbon. The paper used an estimated price of US$50/tonne, and it makes a lot of sense that if you no longer allow everyone to use the atmosphere as a free pollution dump, then innovation and changes will kick in pretty quickly after that.
So how ‘bout it? Shall we price carbon, stop burning it and make our cities and homes healthier places to live?

Agreeing to Zero

If the UN climate negotiations were to actually produce an agreement in 2015 to replace the Kyoto Accord, what would it look like?

WHO: Erik Haites, Margaree Consultants, Toronto, Canada
Farhana Yamin, University College London, Chatham House
Niklas Höhne, Ecofys, Wageningen University

WHAT: The possible legal elements of a 2015 agreement by the UN on climate change mitigation (which they’ve promised to try and do by 2015)

WHEN: 13 October 2013

WHERE: Institute for Sustainable Development and International Relations, Paris,

TITLE:  Possible Elements of a 2015 Legal Agreement on Climate Change (open access)

Let’s take a walk down fantasy lane for a moment since the UNFCCC climate change talks are happening in Warsaw over the next two weeks and imagine that the process begins to work. I’ll take off my cynical and sarcastic hat, and we can imagine together what the world might look like if nations sent negotiators with some actual power to commit their countries to reducing their carbon emissions.

Realistically, as any Canadian who has paid passing attention to the news can tell you, the Harper Government here in Canada is currently spending a lot of time and money muzzling and silencing their scientists who might talk about inconvenient things like climate change. So we know very little will come of these current negotiations. But I digress- as I said, let’s imagine, because that’s what this paper is doing.

These researchers looked at the current negotiations and figured that since all 194 countries that are part of the UN climate negotiations have agreed to negotiate a new legally binding agreement by 2015 to be implemented in 2020, maybe we should sit down and work out what the best one would look like? They helpfully point out that unless there’s an overarching plan for the negotiations that they get bogged down in procedural details, which is true given that Russia held up almost the entire negotiations on deforestation prevention financing in Bonn this year over the agenda.

Yes, Russia held up two weeks of negotiations over the agenda for the meeting (golf clap for Russia).

So to avoid negotiation grandstanding over the formatting of the agenda, what should the game plan be?

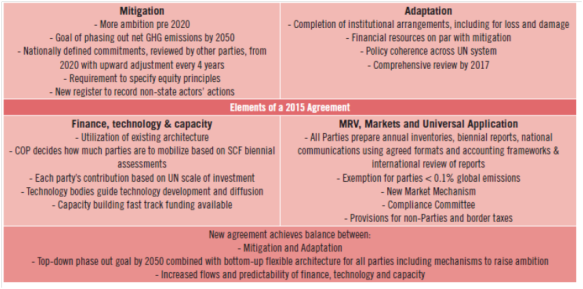
The researchers start by aiming high, stating ‘the climate regime needs to move out of continuous negotiation and into a framework of continuous implementation’ which would be awesome. They suggest we need a hybrid approach – avoiding the ‘top down’ regulation from above that tells countries how they can do things, allowing a ‘bottom up’ approach where countries get to choose how they want to reduce their emissions.

Elements of a 2015 agreement (from paper)

Elements of a 2015 agreement (from paper)

They also suggest we end the current split between developed and least developed countries that has been standard so far in the negotiations (generally Annex 1 countries are the western industrialised countries while non-Annex 1 countries are the developing countries/third world).

Instead of sitting down and trying to hash out exactly what each country is going to do to reduce their carbon emissions, the researchers say they should all agree to have net zero carbon emissions by 2050. Everyone. We all agree to zero by 2050 and then it’s up to each nation to work out how.

Using the words ‘net zero’ gives countries that believe in the commercial viability of carbon capture and storage (CCS) to use that technology and still have zero emissions, but most importantly it leaves the details up to each country.

One planet, different ways to reach zero emissions (Norman Kuring, NASA GSFC, using data from the VIIRS instrument aboard Suomi NPP)

One planet, different ways to reach zero emissions (Norman Kuring, NASA GSFC, using data from the VIIRS instrument aboard Suomi NPP)

The simplicity of this idea means that the only agreement needed for 2015 is ‘we all agree to have zero emissions by 2050 and agree that progress will be monitored by the UNFCCC’ (although the UN will say it in their very wordy form of bureaucrat). It makes the idea quite appealing and possibly(?) achievable?

So let’s imagine that everyone agreed that we should all have net zero carbon emissions by 2050. How would the UNFCCC monitor this?

It will need several things – ways to measure reductions, ways to enforce reductions, ways to avoid free-riding and commitments from each country that get upgraded every four years.

The idea these researchers have is that once everyone signs on, each country is then responsible for proving how they’re going to reduce their emissions. They’ll submit these national plans to the UN and the UN will either approve it or send it back telling them it’s not good enough. Each country will also have to prove they’re doing their fair share to reduce emissions (time to pony up the reductions EU, UK, Canada, US, Australia and others!).

The plans will then be reported on every year with the exception of countries that produce less than 0.1% of global emissions. Something that might be surprising to you – 100 countries fall under that threshold! So those countries would only have to report on their progress to zero emissions every five years.

In order to make the process complete, the agreement would need to include everything – air travel emissions, shipping emissions (and who is responsible for the emissions – the country of origin or the country who ordered the stuff?). There will also need to be more money for climate adaptation, because we are already in the age of climate impacts, which will involve wealthier countries coughing up the $100billion each year they promised and haven’t delivered on.

Oh, and of course the agreement needs to be legally binding because everyone knows voluntary commitments are like buying a gym membership as a New Year’s resolution.

Now of course, my first question when reading about an internationally agreed, legally binding commitment to reduce carbon emissions to zero by 2050 through rolling four-year periods that ramp up each time automatically is whether the unicorns are included or extras.

Complimentary unicorns? (Gordon Ednie, flickr)

Complimentary unicorns? (Gordon Ednie, flickr)

However, the researchers rightly point out that with currently available technologies and some political will, it’s possible to have reduced 90% of carbon emissions by 2050. They list sensible and achievable things to get us there like net zero carbon electricity by 2040, totally recyclable products by 2050, zero energy buildings by 2025, decarbonised and electrified passenger transit by 2040, Hydroflurocarbon (HFC) phase out by 2030, zero food in landfill by 2025 and the end of deforestation by 2025.

Even better, they’ve got a list of things we can do before the agreement kicks in for 2020 like: removing the billions of dollars that is current spent each year subsidising fossil fuels, better energy standards and air pollution standards, regulation of shipping and aviation emissions and incentives for early mitigation. Sounds simple, no?

They also recommend incentives for countries that are beating their reduction targets as well as recognition for companies and other organisations within countries that are doing their part too.

This idea is great, if we could get past the sticking point of getting countries to send negotiators who would actually have the power to agree to a legally binding agreement (this year Australia didn’t bother to send their Minister for the Environment, because the new Prime Minister doesn’t believe in climate change).

But if we did all agree that global emissions should be zero by 2050 (which they need to be to preserve a livable climate), this paper outlines a pretty good idea of what it could look like.

Timing the Carbon Excursion

Trying to fine tune the timeline for the Paleocene-Eocene mass extinction using fossilised mud

WHO: James D. Wright, Department of Earth and Planetary Sciences, Rutgers University
Morgan F. Schallera, Department of Earth and Planetary Sciences, Rutgers University, Department of Geological Sciences, Brown University, Providence, RI

WHAT:  Trying to get a more precise timeline of the Paleocene-Eocene thermal maximum mass extinction (PETM).

WHEN: October 1st, 2013

WHERE: Proceedings of the National Academy of Sciences of the United States of America (PNAS), vol. 110, no. 40, October 2013.

TITLE: Evidence for a rapid release of carbon at the Paleocene-Eocene thermal maximum (subs req.)

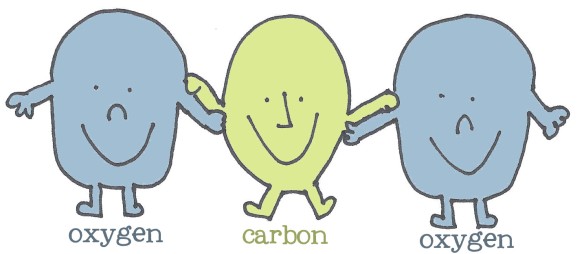
My favourite accidental metaphor from this paper is when the researchers talked about a ‘carbon isotope excursion’ that caused the Paleocene-Eocene thermal maximum, which is scientist for carbon being released into the atmosphere causing a mass extinction. However, I couldn’t help thinking of a school bus full of carbon isotopes…

CO2 getting on a school bus??? (image: Hannah Holt, Lightbulb Books)

CO2 getting on a school bus??? (image: Hannah Holt, Lightbulb Books)

The Paleocene-Eocene thermal maximum (or PETM for short) occurred around 55.8million years ago and is considered the best historical comparison to what we’re currently doing to the atmosphere with carbon pollution. There was rapid global warming of around 6oC which was enough to cause a mass extinction, but from Deep Ocean fossilised carbon isotopes the estimate for the time the extinction took is between less than 750 years and 30,000 years.

Obviously this is a huge window of time, and unless it can be further narrowed down, not very useful for humans trying to work out how long we have left to do something about climate change. Narrowing the time scale for the mass extinction is what these researchers tried to do.

Firstly, there are several ways the PETM mass extinction could have happened. The possibilities are; release of methane from reservoirs like permafrost or under the ocean, wildfires in peatlands, desiccation of the ocean (which is the air warming up enough that the ocean starts evaporating), or meteor impact.

Without working out the timing of the extinction, we can’t work out which method caused the extinction. So these researchers went to an area of the USA called the Salisbury Embayment, which is modern-day Delaware but was shallow ocean 55million years ago. Because it was shallow ocean that fossilised, it has a more detailed record of ancient ocean sediment because it’s now dry land, whereas ocean sediment currently still under the ocean keeps getting changed by ocean currents so only show bigger changes.

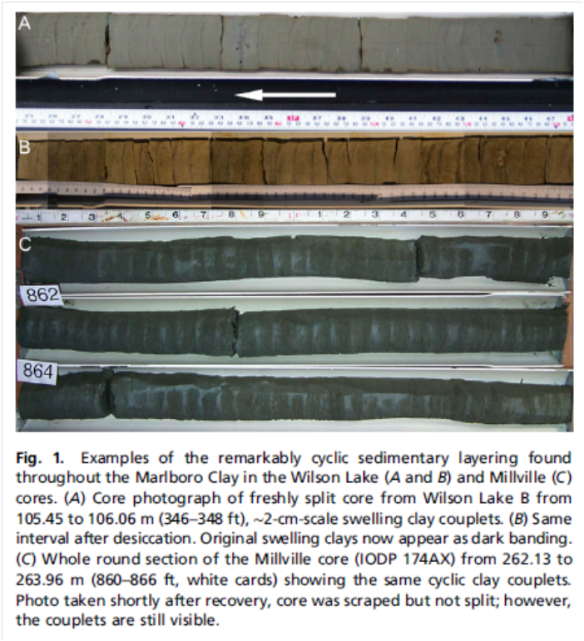
The researchers looked at sediment cores from Wilson Lake B and Millville which have distinct and rhythmic layers of silty clay through the entire section that corresponds to the carbon excursion into the atmosphere.

PNAS sediment cores

Layers of clay in the sediment cores (from paper)

The distinct layers you can see above occur every 1-3cm along the core which allows for a more precise chronology of the mass extinction.

First they ran tests for the amount of 18O (an oxygen isotope) and found cycles of a 1.1% change consistently through the core from Wilson Lake B. They also found a similar cycle in the Millville core. They then tried to work out what kind of time scale this could line up with. After running a few different ideas that didn’t fit with other evidence from the period, they worked out that the oxygen cycles were consistent with seasonal changes and means the sediment cores line up to being 2cm of mud per year. This is excitingly precise! It also fits for what researchers know about the build up of sediment in shallow areas – eg. The Amazon River can accumulate 10cm/year of mud and clay, so 2cm per year fits the other evidence.

Next in the researcher’s Whodunit, they sampled the beginning of the carbon release which was at 273m along the core. To be precise they sampled from 273.37 – 273.96m and tested for 13C (a carbon isotope).

They found the concentration of carbon dropped in the silt to 3.9%, then 1.45% and then to -2.48% over thirteen years. A drop in the ocean concentration of carbon means it’s being released into the atmosphere. The concentration of calcium carbonate (CaCO3) which is what shells are made of also dropped from 6% to 1% within a single layer of sediment. So there was definitely something going on, but what exactly was it?

The beginning of the carbon release is the unknown bit, and it’s generally agreed that the recovery from the 6oC of global warming took 150,000 years. The sediment layers show that the release of carbon was almost instantaneous (happened over 13 years) and after the release it took between 200-2,000 years for the ocean and the atmosphere to reach a new equilibrium. This means that after the initial carbon release the atmosphere changed rapidly for the next 2,000 years before it reached the ‘new normal’. From there it then took 150,000 years to go back to the original normal from before the carbon release.

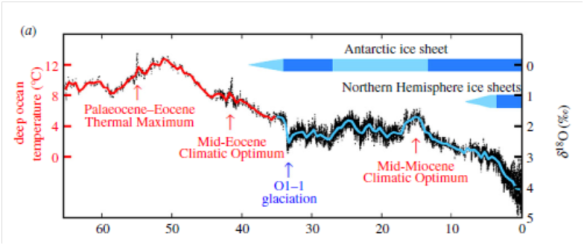
Long road to recovery – PETM followed by 2,000 years of change, then a slow slope back to normal temps (from Hansen et. al PNAS 2013)

Long road to recovery – PETM followed by a slow slope back to normal temps (from Hansen et. al PNAS 2013) bottom scale in millions of years.

Looking back at what order of events could have caused this for a mass extinction, the only one that fits is methane release AND a meteorite. There was a recovery of carbon isotope concentrations in the upper clay which the researchers state indicates it was carbon from the atmosphere going into the ocean, with a greater level of carbon movement in the shallow areas than the deep ones. However, the meteorite alone (which is the carbon from the atmosphere into the ocean) wouldn’t be enough to cause 6oC of global warming. It requires around 3,000 Gigatonnes (Gt) of carbon to change the atmosphere by that degree, hence why the researchers think it was a meteorite and methane release from the ocean that add up to the 3,000Gt.

So what are the lessons for humanity in this great carbon excursion of mass extinction? Firstly, climate change can happen quite quickly. Secondly, once you’ve changed the atmosphere, it’s a long road back to the normal you had before you burned the carbon. Thirdly, it only takes 3,000Gt of carbon to cause a mass extinction.

The last UN IPCC report gave the planet a carbon budget of 1,000Gt of total emissions to keep humanity in a level of ‘safe’ climate change. Currently, the world has burned half of that budget and will blow through the rest of it within the next 30 years. If we burn enough carbon to start releasing methane from permafrost or the oceans, it’s a 150,000 year trek back from a possible mass extinction.

I guess it is true – those who don’t learn from history are doomed to repeat it. How about we learn from history and stop burning carbon?


Oct. 29th – caption for Cenozoic era graph changed for clarity (time scale is different as the graph is from a different paper).

Smoking Kills, so does Climate Change

A translation of the IPCC 5th Assessment Report Summary for Policymakers

WHO: The Intergovernmental Panel on Climate Change

WHAT: Summary for policy makers of their 2000 page 5th Assessment Report (AR5) of the state of the climate and climate science.

WHEN: 27 September 2013

WHERE: On the IPCC website

TITLE: Climate Change 2013: The Physical Science Basis Summary for Policymakers (open access)

There’s a lot of things not to like about the way the IPCC communicates what they do, but for me the main one is that they speak a very specific dialect of bureaucrat that no-one else understands unless they’ve also worked on UN things and speak the same sort of acronym.

The worst bit of this dialect of bureaucrat is the words they use to describe how confident they are that their findings are correct. They probably believe they’re being really clear, however they use language that none of the rest of us would ever use and it means their findings make little sense without their ‘very likely = 90-100% certain’ footnote at the front.

So now that we’ve established that the UN doesn’t speak an understandable form of English, what does the report actually say? It works its way through each of the different climate systems and how they’re changing because humans are burning fossil fuels.

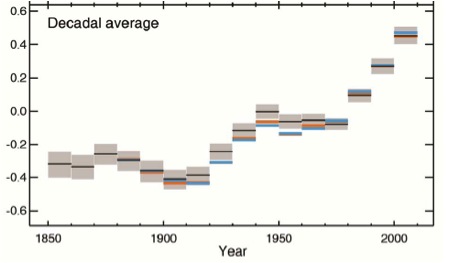
As you can see from this lovely graph, each of the last three decades has been noticeably warmer than the proceeding one, and the IPCC are 66% sure that 1983-2012 was the warmest 30 year period in 1,400 years.

Decade by decade average temperatures (Y axis is change in Celsius from base year of 1950) (from paper)

Decade by decade average temperatures (Y axis is change in Celsius from base year of 1950) (from paper)

One of the reasons I really like this graph is you can see how the rate of change is speeding up (one of the key dangers with climate change). From 1850 through to around 1980 each decade’s average is touching the box of the average before it, until after the 80s when the heat shoots up much more rapidly.

The report did have this dig for the deniers though: ‘Due to natural variability, trends based on short records are very sensitive to the beginning and end dates and do not in general reflect long-term climate trends’. Which is UN bureaucrat for ‘when you cherry pick data to fit your denier talking points you’re doing it wrong’.

Looking at regional atmospheric trends, the report notes that while things like the Medieval Warm Period did have multi-decadal periods of change, these changes didn’t happen across the whole globe like the warming currently being measured.

In the oceans, the top layer has warmed (the top 75m) by 0.11oC per decade from 1971 to 2010, and more than 60% of the carbon energy we’ve pumped into the atmosphere since 1971 has been stored in the top layer, with another 30% being stored in the ocean below 700m.

This extra heat is not just causing thermal expansion, it’s speeding up sea level rise, which the IPCC are 90% certain increased from 1901 to 2010 from 1.7mm per year to 3.2mm per year. This is now happening faster than the past two millenniums. Yes, sea level is rising faster than it has for the last 2,000,000 years so you might want to sell your waterfront property sooner, rather than later.

The extra carbon has also made it harder to live in the ocean if you own a shell, because the acidity of the ocean has increased by 26% which makes shells thinner and harder to grow.

On the glaciers and the ice sheets, the IPCC is 90% certain that the rate of melting from Greenland has increased from 34Gigatonnes (Gt) of ice per year to 215Gt of ice after 2002. Yes, increased from 34Gt to 215Gt – it’s melting six times faster now thanks to us.

For Antarctica, the IPCC is 66% certain that the rate of ice loss has increased from 30Gt per year to 147Gt per year, with most of that loss coming from the Northern Peninsula and West Antarctica. Worryingly, this ice loss will also include the parts of Antarctica that are gaining ice due to natural variability.

And at the North Pole, Santa is going to have to buy himself and his elves some boats or floating pontoons soon, because the IPCC have found ‘multiple lines of evidence support[ing] very substantial Artctic warming since the mid-20th Century’. Sorry Santa!

As for the carbon we’ve been spewing into the atmosphere since the 1850s, well, we’re winning that race too! ‘The atmospheric concentrations of carbon dioxide, methane and nitrous oxide have increased to levels unprecedented in at least the last 800,000 years’. Congratulations humanity – in the last century and a half, we’ve changed the composition of the atmosphere so rapidly that this hasn’t been seen in 800,000 years!

Methane levels have gone up by 150%, and I’m undecided as to whether that means I should eat more beef to stop the cows from farting, or if it means we raised too many cows to be steaks in the first place…

This is the part of the report where we get into the one excellent thing the IPCC did this time around – our carbon budget. I’m not sure whether they realised that committing to reduce certain percentages by certain years from different baselines meant that governments were able to shuffle the numbers to do nothing and make themselves look good at the same time, but this is a promising step.

I’ve written about the very excellent work of Kevin Anderson at the Tyndall Centre in the UK before, but the basic deal with a carbon budget is this: it doesn’t matter when we burn the carbon or how fast, all the matters is the total emissions in the end. You can eat half the chocolate bar now, and half the chocolate bar later, but you’re still eating a whole bar.

Our budget to have a 2/3 chance of not going beyond dangerous climate change is 1,000Gt of carbon and so far we’ve burnt 545Gt, so we’re more than halfway there. All of this leads to the conclusion that ‘human influence on the climate system is clear. This is evident from the increasing greenhouse gas concentrations in the atmosphere, positive radiative forcing, observed warming and understanding of the climate system.’

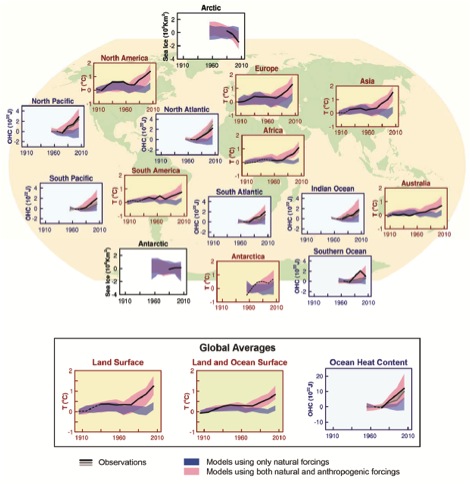
What observations you may ask? Scientists have made progress on working out how climate change pumps extreme weather up and makes it worse. They also got it right for the frequency of extreme warm and cold days, which if you live in North America was the hot extremes winning 10:1 over the cold extremes. Round of applause for science everyone!

Warming with natural forcing vs human forcing and how it lines up with the observations (from paper)

Warming with natural forcing vs human forcing and how it lines up with the observations (from paper)

They’re also 95% sure that more than half of the observed global surface warming from 1951 is from humanity. So next time there’s a nasty heatwave that’s more frequent than it should be, blame humans.

The report does also point out though that even though the heat records are beating the cold records 10-1, this doesn’t mean that snow disproves climate change (sorry Fox News!). There will still be yearly and decade by decade by variability in how our planet cooks which will not be the same across the whole planet. Which sounds to me like we’re being warmed in an uneven microwave. For instance, El Niño and La Niña will still be big influencers over the Pacific and will determine to a great extent the variability in the Pacific North West (yeah, it’s still going to rain a lot Vancouver).

For those that were fans of the film The Day After Tomorrow, there’s a 66% chance the Atlantic Meridional Circulation will slow down, but only a 10% chance it will undergo an abrupt change or collapse like it did in the film, so you’re not going to be running away from a flash freezing ocean any time this century.

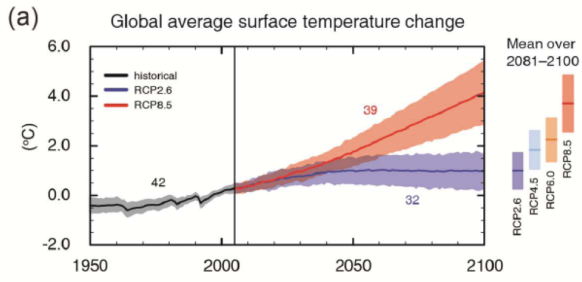
The report then runs through the different scenarios they’ve decided to model that range from ‘we did a lot to reduce carbon emissions’ to ‘we did nothing to reduce carbon emissions and burned all the fossil fuels’. Because this is the IPCC and they had to get EVERYONE to agree on each line of the report (I’m serious, they approved it line by line, which has to be the most painful process I can think of) the scenarios are conservative in their estimations, not measuring tipping points (which are really hard to incorporate anyway). So their ‘worst case scenario’ is only 4.0oC of surface warming by 2100.

Representative Concentration Pathway (RCP) Scenarios from the IPCC AR5

Representative Concentration Pathway (RCP) Scenarios from the IPCC AR5

Now, obviously ‘only’ 4oC of climate change by the end of the century is still pretty unbearable. There will still be a lot of hardship, drought, famine, refugee migration and uninhabitable parts of the planet with 4oC. However, once we get to 4oC, it’s likely to have triggered tipping points like methane release from permafrost, so 4oC would be a stopping point towards 6oC even if we ran out of carbon to burn. And 6oC of course, as you all hear me say frequently is mass extinction time. It’s also the point at which even if humanity did survive, you wouldn’t want to live here anymore.

The paper finishes up with a subtle dig at the insanity of relying on geoengineering, pointing out that trying to put shade reflectors into orbit or artificially suck carbon out of the air has a high chance of going horribly wrong. They also point out that if we did manage large scale geoegineering and it then broke down, re-releasing that carbon back into the atmosphere would super-cook the planet really quickly.

The moral of this 36 page ‘summary’ is that it’s us guys. We’re as certain that we’ve done this as we are that smoking causes cancer. We have burned this carbon and it’s changed the chemical energy balance of the atmosphere and if we don’t stop burning carbon we’re going to cook the whole planet. Seriously. So let’s finally, actually stop burning carbon.